Houma vs Immigrants from Singapore Currently Married
COMPARE
Houma
Immigrants from Singapore
Currently Married
Currently Married Comparison
Houma
Immigrants from Singapore
45.5%
CURRENTLY MARRIED
7.2/ 100
METRIC RATING
211th/ 347
METRIC RANK
47.8%
CURRENTLY MARRIED
93.3/ 100
METRIC RATING
105th/ 347
METRIC RANK
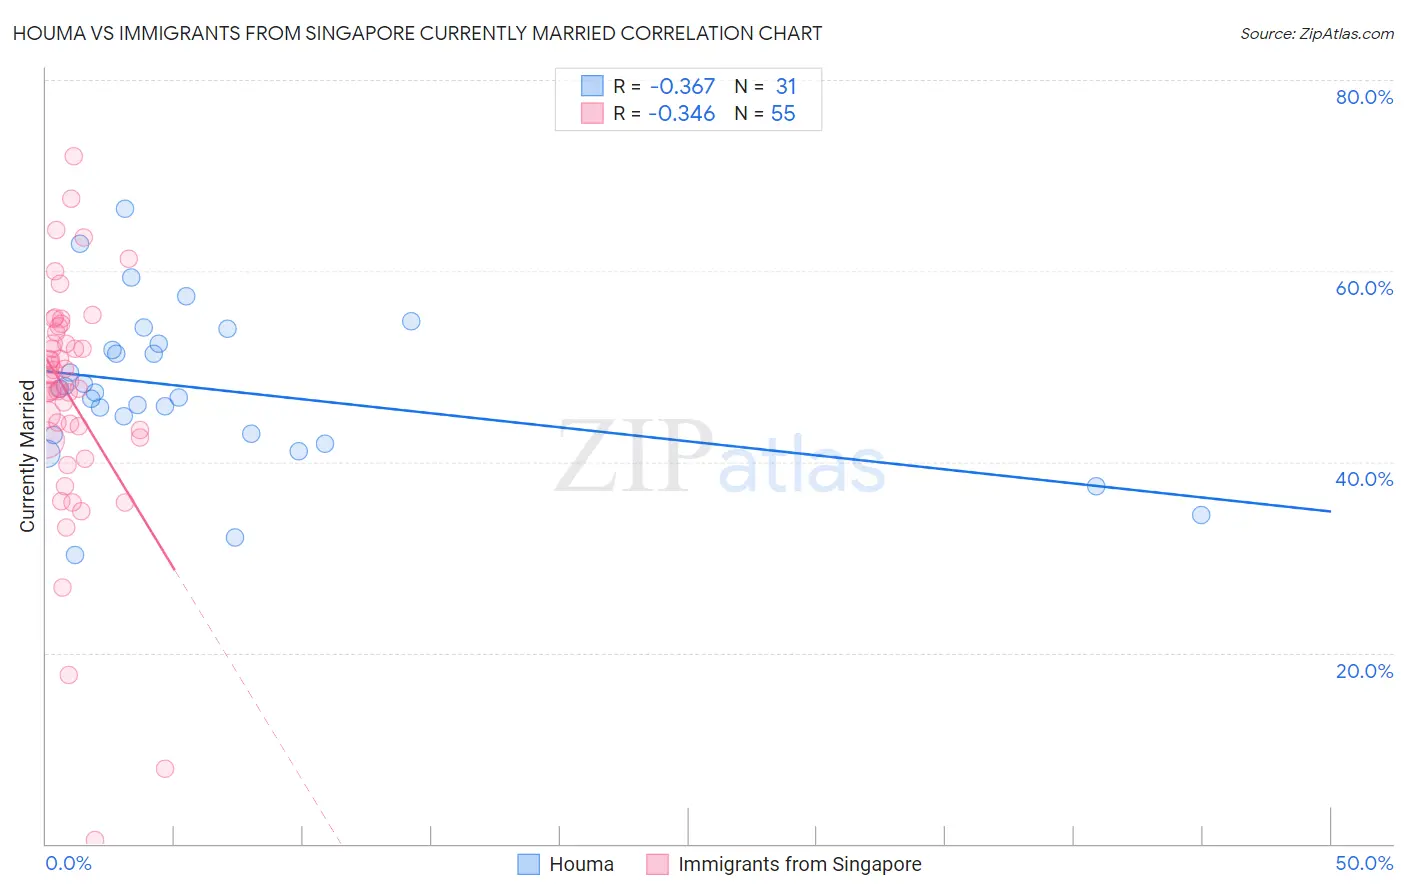
Houma vs Immigrants from Singapore Currently Married Correlation Chart
The statistical analysis conducted on geographies consisting of 36,796,778 people shows a mild negative correlation between the proportion of Houma and percentage of population currently married in the United States with a correlation coefficient (R) of -0.367 and weighted average of 45.5%. Similarly, the statistical analysis conducted on geographies consisting of 137,494,122 people shows a mild negative correlation between the proportion of Immigrants from Singapore and percentage of population currently married in the United States with a correlation coefficient (R) of -0.346 and weighted average of 47.8%, a difference of 4.9%.
Currently Married Correlation Summary
| Measurement | Houma | Immigrants from Singapore |
| Minimum | 30.2% | 0.40% |
| Maximum | 66.5% | 72.0% |
| Range | 36.3% | 71.6% |
| Mean | 47.6% | 46.7% |
| Median | 47.3% | 48.4% |
| Interquartile 25% (IQ1) | 42.8% | 42.6% |
| Interquartile 75% (IQ3) | 52.4% | 53.5% |
| Interquartile Range (IQR) | 9.6% | 10.9% |
| Standard Deviation (Sample) | 8.2% | 12.7% |
| Standard Deviation (Population) | 8.1% | 12.6% |
Similar Demographics by Currently Married
Demographics Similar to Houma by Currently Married
In terms of currently married, the demographic groups most similar to Houma are Marshallese (45.5%, a difference of 0.010%), Alaska Native (45.5%, a difference of 0.040%), Dutch West Indian (45.5%, a difference of 0.080%), German Russian (45.5%, a difference of 0.080%), and Uruguayan (45.6%, a difference of 0.090%).
| Demographics | Rating | Rank | Currently Married |
| Immigrants | Spain | 11.6 /100 | #204 | Poor 45.8% |
| South American Indians | 11.5 /100 | #205 | Poor 45.8% |
| Immigrants | Immigrants | 11.2 /100 | #206 | Poor 45.8% |
| Immigrants | South America | 10.8 /100 | #207 | Poor 45.7% |
| Alsatians | 10.8 /100 | #208 | Poor 45.7% |
| Immigrants | Micronesia | 8.8 /100 | #209 | Tragic 45.6% |
| Uruguayans | 7.9 /100 | #210 | Tragic 45.6% |
| Houma | 7.2 /100 | #211 | Tragic 45.5% |
| Marshallese | 7.2 /100 | #212 | Tragic 45.5% |
| Alaska Natives | 7.0 /100 | #213 | Tragic 45.5% |
| Dutch West Indians | 6.7 /100 | #214 | Tragic 45.5% |
| German Russians | 6.7 /100 | #215 | Tragic 45.5% |
| Immigrants | Morocco | 5.5 /100 | #216 | Tragic 45.4% |
| Immigrants | Thailand | 5.1 /100 | #217 | Tragic 45.4% |
| Panamanians | 4.0 /100 | #218 | Tragic 45.3% |
Demographics Similar to Immigrants from Singapore by Currently Married
In terms of currently married, the demographic groups most similar to Immigrants from Singapore are Immigrants from Greece (47.7%, a difference of 0.030%), Serbian (47.8%, a difference of 0.050%), Immigrants from Italy (47.7%, a difference of 0.060%), Cypriot (47.8%, a difference of 0.070%), and Turkish (47.8%, a difference of 0.090%).
| Demographics | Rating | Rank | Currently Married |
| Immigrants | China | 94.7 /100 | #98 | Exceptional 47.9% |
| Immigrants | Sweden | 94.3 /100 | #99 | Exceptional 47.8% |
| Celtics | 94.2 /100 | #100 | Exceptional 47.8% |
| Immigrants | Germany | 94.1 /100 | #101 | Exceptional 47.8% |
| Turks | 93.9 /100 | #102 | Exceptional 47.8% |
| Cypriots | 93.7 /100 | #103 | Exceptional 47.8% |
| Serbians | 93.6 /100 | #104 | Exceptional 47.8% |
| Immigrants | Singapore | 93.3 /100 | #105 | Exceptional 47.8% |
| Immigrants | Greece | 93.1 /100 | #106 | Exceptional 47.7% |
| Immigrants | Italy | 92.9 /100 | #107 | Exceptional 47.7% |
| Tsimshian | 92.4 /100 | #108 | Exceptional 47.7% |
| Immigrants | Egypt | 92.3 /100 | #109 | Exceptional 47.7% |
| Immigrants | Russia | 92.0 /100 | #110 | Exceptional 47.7% |
| Immigrants | Hungary | 91.2 /100 | #111 | Exceptional 47.6% |
| Immigrants | Western Europe | 91.1 /100 | #112 | Exceptional 47.6% |