Houma vs Czechoslovakian Single Father Poverty
COMPARE
Houma
Czechoslovakian
Single Father Poverty
Single Father Poverty Comparison
Houma
Czechoslovakians
26.7%
SINGLE FATHER POVERTY
0.0/ 100
METRIC RATING
340th/ 347
METRIC RANK
17.1%
SINGLE FATHER POVERTY
1.3/ 100
METRIC RATING
248th/ 347
METRIC RANK
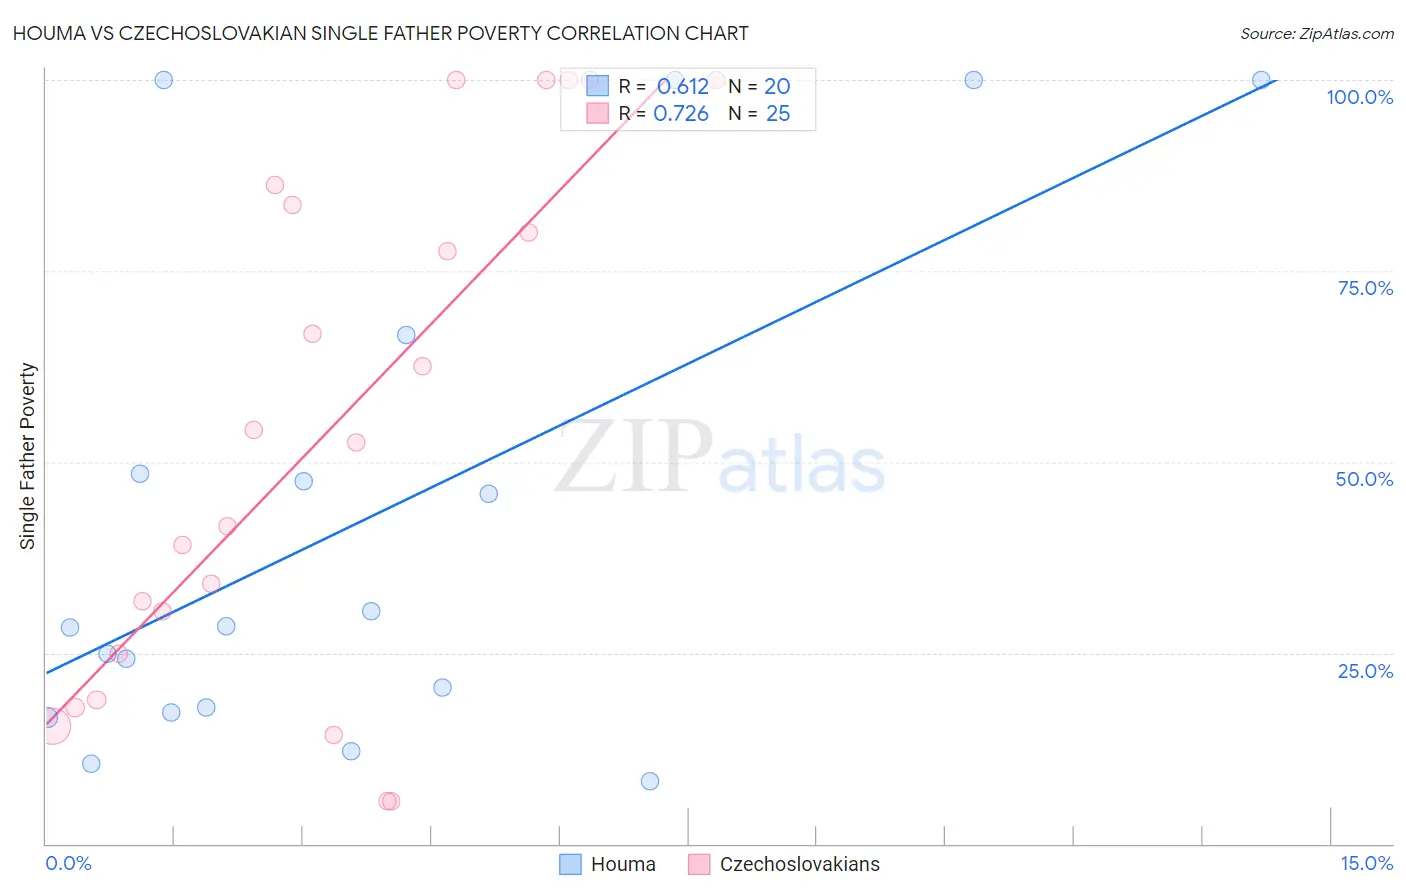
Houma vs Czechoslovakian Single Father Poverty Correlation Chart
The statistical analysis conducted on geographies consisting of 35,236,352 people shows a significant positive correlation between the proportion of Houma and poverty level among single fathers in the United States with a correlation coefficient (R) of 0.612 and weighted average of 26.7%. Similarly, the statistical analysis conducted on geographies consisting of 285,091,389 people shows a strong positive correlation between the proportion of Czechoslovakians and poverty level among single fathers in the United States with a correlation coefficient (R) of 0.726 and weighted average of 17.1%, a difference of 56.6%.
Single Father Poverty Correlation Summary
| Measurement | Houma | Czechoslovakian |
| Minimum | 8.2% | 5.5% |
| Maximum | 100.0% | 100.0% |
| Range | 91.8% | 94.5% |
| Mean | 42.4% | 53.7% |
| Median | 28.3% | 52.6% |
| Interquartile 25% (IQ1) | 17.5% | 21.8% |
| Interquartile 75% (IQ3) | 57.6% | 85.0% |
| Interquartile Range (IQR) | 40.0% | 63.1% |
| Standard Deviation (Sample) | 32.9% | 33.5% |
| Standard Deviation (Population) | 32.1% | 32.8% |
Similar Demographics by Single Father Poverty
Demographics Similar to Houma by Single Father Poverty
In terms of single father poverty, the demographic groups most similar to Houma are Hopi (27.2%, a difference of 1.6%), Yuman (28.4%, a difference of 6.2%), Lumbee (28.5%, a difference of 6.5%), Navajo (29.2%, a difference of 9.3%), and Apache (24.2%, a difference of 10.3%).
| Demographics | Rating | Rank | Single Father Poverty |
| Natives/Alaskans | 0.0 /100 | #333 | Tragic 22.4% |
| Kiowa | 0.0 /100 | #334 | Tragic 22.5% |
| Shoshone | 0.0 /100 | #335 | Tragic 22.9% |
| Cajuns | 0.0 /100 | #336 | Tragic 23.1% |
| Sioux | 0.0 /100 | #337 | Tragic 23.9% |
| Arapaho | 0.0 /100 | #338 | Tragic 24.0% |
| Apache | 0.0 /100 | #339 | Tragic 24.2% |
| Houma | 0.0 /100 | #340 | Tragic 26.7% |
| Hopi | 0.0 /100 | #341 | Tragic 27.2% |
| Yuman | 0.0 /100 | #342 | Tragic 28.4% |
| Lumbee | 0.0 /100 | #343 | Tragic 28.5% |
| Navajo | 0.0 /100 | #344 | Tragic 29.2% |
| Crow | 0.0 /100 | #345 | Tragic 30.3% |
| Puerto Ricans | 0.0 /100 | #346 | Tragic 31.5% |
| Yup'ik | 0.0 /100 | #347 | Tragic 32.5% |
Demographics Similar to Czechoslovakians by Single Father Poverty
In terms of single father poverty, the demographic groups most similar to Czechoslovakians are Greek (17.1%, a difference of 0.0%), Canadian (17.1%, a difference of 0.040%), Immigrants from Ireland (17.1%, a difference of 0.10%), Trinidadian and Tobagonian (17.0%, a difference of 0.14%), and Austrian (17.1%, a difference of 0.17%).
| Demographics | Rating | Rank | Single Father Poverty |
| Czechs | 2.3 /100 | #241 | Tragic 17.0% |
| Moroccans | 2.1 /100 | #242 | Tragic 17.0% |
| Immigrants | Cabo Verde | 1.6 /100 | #243 | Tragic 17.0% |
| Hondurans | 1.6 /100 | #244 | Tragic 17.0% |
| Trinidadians and Tobagonians | 1.5 /100 | #245 | Tragic 17.0% |
| Immigrants | Ireland | 1.4 /100 | #246 | Tragic 17.1% |
| Greeks | 1.3 /100 | #247 | Tragic 17.1% |
| Czechoslovakians | 1.3 /100 | #248 | Tragic 17.1% |
| Canadians | 1.3 /100 | #249 | Tragic 17.1% |
| Austrians | 1.1 /100 | #250 | Tragic 17.1% |
| Luxembourgers | 1.1 /100 | #251 | Tragic 17.1% |
| Croatians | 1.0 /100 | #252 | Tragic 17.1% |
| Cree | 1.0 /100 | #253 | Tragic 17.1% |
| Immigrants | Honduras | 0.9 /100 | #254 | Tragic 17.1% |
| Sierra Leoneans | 0.8 /100 | #255 | Tragic 17.2% |