Houma vs Cypriot Single Father Poverty
COMPARE
Houma
Cypriot
Single Father Poverty
Single Father Poverty Comparison
Houma
Cypriots
26.7%
SINGLE FATHER POVERTY
0.0/ 100
METRIC RATING
340th/ 347
METRIC RANK
15.9%
SINGLE FATHER POVERTY
87.5/ 100
METRIC RATING
136th/ 347
METRIC RANK
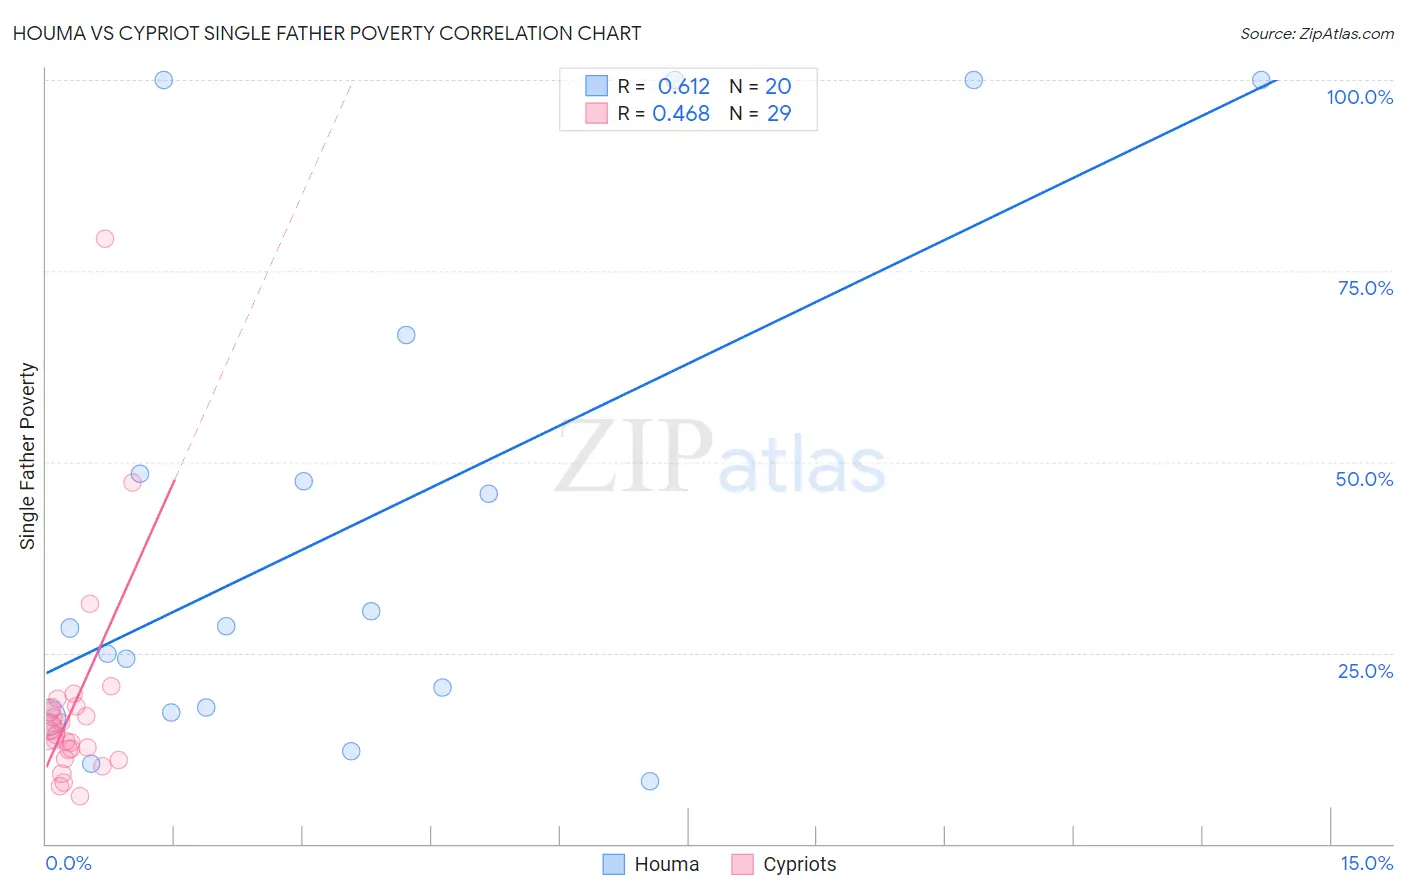
Houma vs Cypriot Single Father Poverty Correlation Chart
The statistical analysis conducted on geographies consisting of 35,236,352 people shows a significant positive correlation between the proportion of Houma and poverty level among single fathers in the United States with a correlation coefficient (R) of 0.612 and weighted average of 26.7%. Similarly, the statistical analysis conducted on geographies consisting of 55,535,084 people shows a moderate positive correlation between the proportion of Cypriots and poverty level among single fathers in the United States with a correlation coefficient (R) of 0.468 and weighted average of 15.9%, a difference of 67.7%.
Single Father Poverty Correlation Summary
| Measurement | Houma | Cypriot |
| Minimum | 8.2% | 6.2% |
| Maximum | 100.0% | 79.2% |
| Range | 91.8% | 72.9% |
| Mean | 42.4% | 17.9% |
| Median | 28.3% | 14.6% |
| Interquartile 25% (IQ1) | 17.5% | 11.7% |
| Interquartile 75% (IQ3) | 57.6% | 17.9% |
| Interquartile Range (IQR) | 40.0% | 6.2% |
| Standard Deviation (Sample) | 32.9% | 14.1% |
| Standard Deviation (Population) | 32.1% | 13.9% |
Similar Demographics by Single Father Poverty
Demographics Similar to Houma by Single Father Poverty
In terms of single father poverty, the demographic groups most similar to Houma are Hopi (27.2%, a difference of 1.6%), Yuman (28.4%, a difference of 6.2%), Lumbee (28.5%, a difference of 6.5%), Navajo (29.2%, a difference of 9.3%), and Apache (24.2%, a difference of 10.3%).
| Demographics | Rating | Rank | Single Father Poverty |
| Natives/Alaskans | 0.0 /100 | #333 | Tragic 22.4% |
| Kiowa | 0.0 /100 | #334 | Tragic 22.5% |
| Shoshone | 0.0 /100 | #335 | Tragic 22.9% |
| Cajuns | 0.0 /100 | #336 | Tragic 23.1% |
| Sioux | 0.0 /100 | #337 | Tragic 23.9% |
| Arapaho | 0.0 /100 | #338 | Tragic 24.0% |
| Apache | 0.0 /100 | #339 | Tragic 24.2% |
| Houma | 0.0 /100 | #340 | Tragic 26.7% |
| Hopi | 0.0 /100 | #341 | Tragic 27.2% |
| Yuman | 0.0 /100 | #342 | Tragic 28.4% |
| Lumbee | 0.0 /100 | #343 | Tragic 28.5% |
| Navajo | 0.0 /100 | #344 | Tragic 29.2% |
| Crow | 0.0 /100 | #345 | Tragic 30.3% |
| Puerto Ricans | 0.0 /100 | #346 | Tragic 31.5% |
| Yup'ik | 0.0 /100 | #347 | Tragic 32.5% |
Demographics Similar to Cypriots by Single Father Poverty
In terms of single father poverty, the demographic groups most similar to Cypriots are Immigrants from the Azores (15.9%, a difference of 0.030%), Central American (16.0%, a difference of 0.040%), Immigrants from Sri Lanka (15.9%, a difference of 0.070%), Immigrants from South America (15.9%, a difference of 0.10%), and South American (16.0%, a difference of 0.16%).
| Demographics | Rating | Rank | Single Father Poverty |
| Immigrants | West Indies | 90.8 /100 | #129 | Exceptional 15.9% |
| Norwegians | 90.2 /100 | #130 | Exceptional 15.9% |
| Nicaraguans | 90.1 /100 | #131 | Exceptional 15.9% |
| Immigrants | Portugal | 89.7 /100 | #132 | Excellent 15.9% |
| Immigrants | Syria | 89.5 /100 | #133 | Excellent 15.9% |
| Immigrants | South America | 88.5 /100 | #134 | Excellent 15.9% |
| Immigrants | Sri Lanka | 88.2 /100 | #135 | Excellent 15.9% |
| Cypriots | 87.5 /100 | #136 | Excellent 15.9% |
| Immigrants | Azores | 87.2 /100 | #137 | Excellent 15.9% |
| Central Americans | 87.1 /100 | #138 | Excellent 16.0% |
| South Americans | 85.9 /100 | #139 | Excellent 16.0% |
| Immigrants | Netherlands | 85.3 /100 | #140 | Excellent 16.0% |
| Liberians | 83.3 /100 | #141 | Excellent 16.0% |
| Immigrants | Mexico | 83.3 /100 | #142 | Excellent 16.0% |
| Immigrants | Central America | 83.1 /100 | #143 | Excellent 16.0% |