Hopi vs Osage Master's Degree
COMPARE
Hopi
Osage
Master's Degree
Master's Degree Comparison
Hopi
Osage
10.9%
MASTER'S DEGREE
0.0/ 100
METRIC RATING
317th/ 347
METRIC RANK
12.6%
MASTER'S DEGREE
0.7/ 100
METRIC RATING
257th/ 347
METRIC RANK
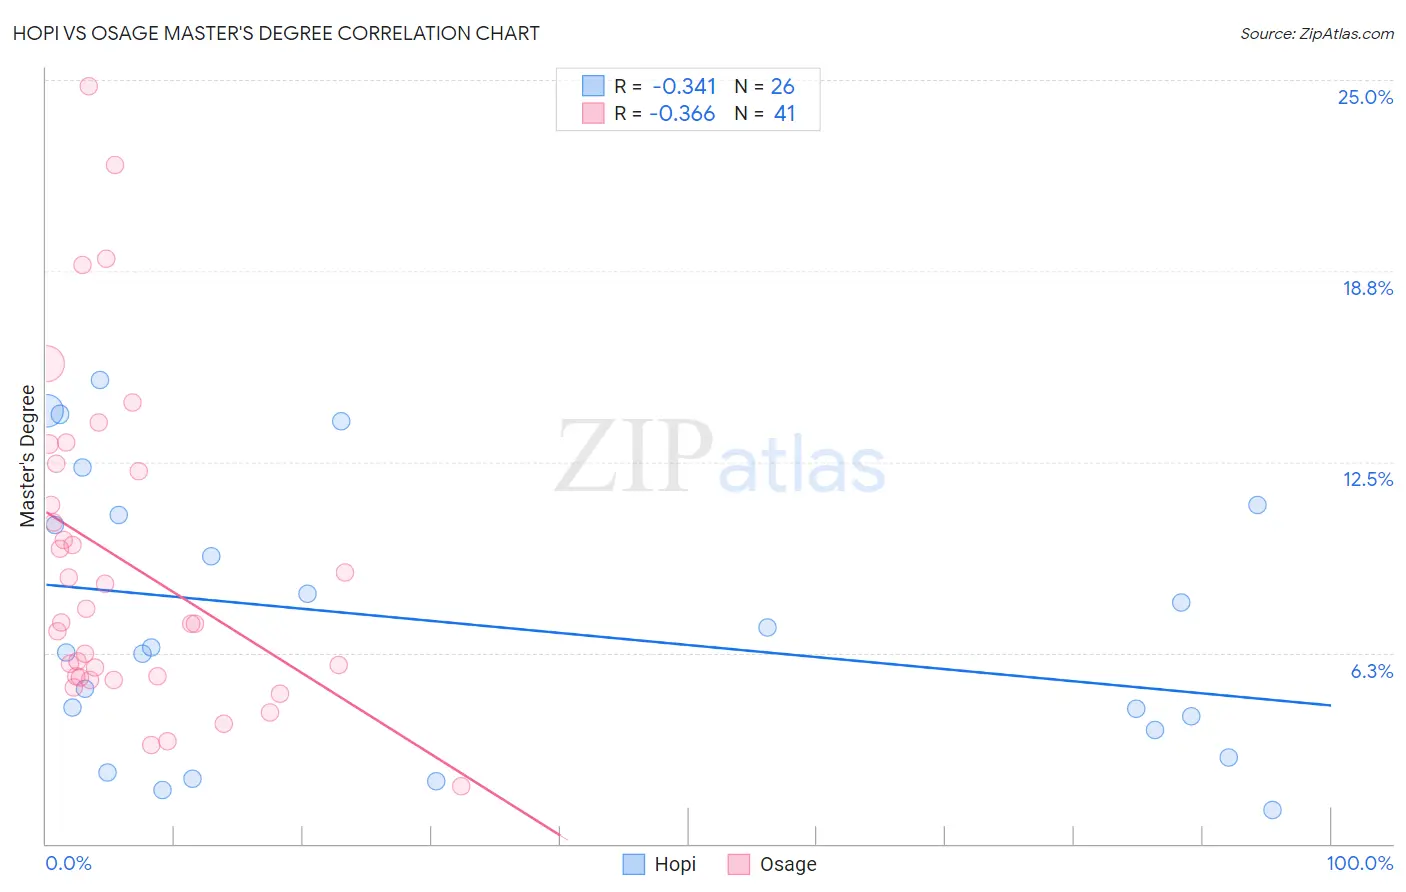
Hopi vs Osage Master's Degree Correlation Chart
The statistical analysis conducted on geographies consisting of 74,729,525 people shows a mild negative correlation between the proportion of Hopi and percentage of population with at least master's degree education in the United States with a correlation coefficient (R) of -0.341 and weighted average of 10.9%. Similarly, the statistical analysis conducted on geographies consisting of 91,790,824 people shows a mild negative correlation between the proportion of Osage and percentage of population with at least master's degree education in the United States with a correlation coefficient (R) of -0.366 and weighted average of 12.6%, a difference of 15.6%.
Master's Degree Correlation Summary
| Measurement | Hopi | Osage |
| Minimum | 1.1% | 1.9% |
| Maximum | 15.2% | 24.8% |
| Range | 14.1% | 22.9% |
| Mean | 7.2% | 9.2% |
| Median | 6.3% | 7.2% |
| Interquartile 25% (IQ1) | 3.7% | 5.5% |
| Interquartile 75% (IQ3) | 10.8% | 12.3% |
| Interquartile Range (IQR) | 7.0% | 6.9% |
| Standard Deviation (Sample) | 4.4% | 5.3% |
| Standard Deviation (Population) | 4.3% | 5.2% |
Similar Demographics by Master's Degree
Demographics Similar to Hopi by Master's Degree
In terms of master's degree, the demographic groups most similar to Hopi are Immigrants from Cuba (10.9%, a difference of 0.13%), Kiowa (10.8%, a difference of 0.37%), Hispanic or Latino (10.9%, a difference of 0.54%), Cajun (11.0%, a difference of 0.88%), and Apache (11.0%, a difference of 0.88%).
| Demographics | Rating | Rank | Master's Degree |
| Shoshone | 0.0 /100 | #310 | Tragic 11.1% |
| Seminole | 0.0 /100 | #311 | Tragic 11.0% |
| Choctaw | 0.0 /100 | #312 | Tragic 11.0% |
| Yaqui | 0.0 /100 | #313 | Tragic 11.0% |
| Cajuns | 0.0 /100 | #314 | Tragic 11.0% |
| Apache | 0.0 /100 | #315 | Tragic 11.0% |
| Hispanics or Latinos | 0.0 /100 | #316 | Tragic 10.9% |
| Hopi | 0.0 /100 | #317 | Tragic 10.9% |
| Immigrants | Cuba | 0.0 /100 | #318 | Tragic 10.9% |
| Kiowa | 0.0 /100 | #319 | Tragic 10.8% |
| Immigrants | Micronesia | 0.0 /100 | #320 | Tragic 10.8% |
| Pennsylvania Germans | 0.0 /100 | #321 | Tragic 10.7% |
| Sioux | 0.0 /100 | #322 | Tragic 10.7% |
| Crow | 0.0 /100 | #323 | Tragic 10.6% |
| Dutch West Indians | 0.0 /100 | #324 | Tragic 10.6% |
Demographics Similar to Osage by Master's Degree
In terms of master's degree, the demographic groups most similar to Osage are Immigrants from Portugal (12.6%, a difference of 0.48%), Immigrants from Liberia (12.5%, a difference of 0.50%), Immigrants from Congo (12.6%, a difference of 0.55%), Indonesian (12.6%, a difference of 0.58%), and Japanese (12.5%, a difference of 0.59%).
| Demographics | Rating | Rank | Master's Degree |
| Liberians | 1.3 /100 | #250 | Tragic 12.8% |
| Tlingit-Haida | 1.3 /100 | #251 | Tragic 12.8% |
| French American Indians | 1.0 /100 | #252 | Tragic 12.7% |
| Immigrants | Dominica | 0.8 /100 | #253 | Tragic 12.6% |
| Indonesians | 0.8 /100 | #254 | Tragic 12.6% |
| Immigrants | Congo | 0.8 /100 | #255 | Tragic 12.6% |
| Immigrants | Portugal | 0.8 /100 | #256 | Tragic 12.6% |
| Osage | 0.7 /100 | #257 | Tragic 12.6% |
| Immigrants | Liberia | 0.6 /100 | #258 | Tragic 12.5% |
| Japanese | 0.6 /100 | #259 | Tragic 12.5% |
| Dominicans | 0.6 /100 | #260 | Tragic 12.5% |
| Tongans | 0.6 /100 | #261 | Tragic 12.5% |
| Nicaraguans | 0.6 /100 | #262 | Tragic 12.5% |
| Central American Indians | 0.5 /100 | #263 | Tragic 12.4% |
| Belizeans | 0.5 /100 | #264 | Tragic 12.4% |