Hopi vs Carpatho Rusyn Single Father Poverty
COMPARE
Hopi
Carpatho Rusyn
Single Father Poverty
Single Father Poverty Comparison
Hopi
Carpatho Rusyns
27.2%
SINGLE FATHER POVERTY
0.0/ 100
METRIC RATING
341st/ 347
METRIC RANK
18.0%
SINGLE FATHER POVERTY
0.0/ 100
METRIC RATING
287th/ 347
METRIC RANK
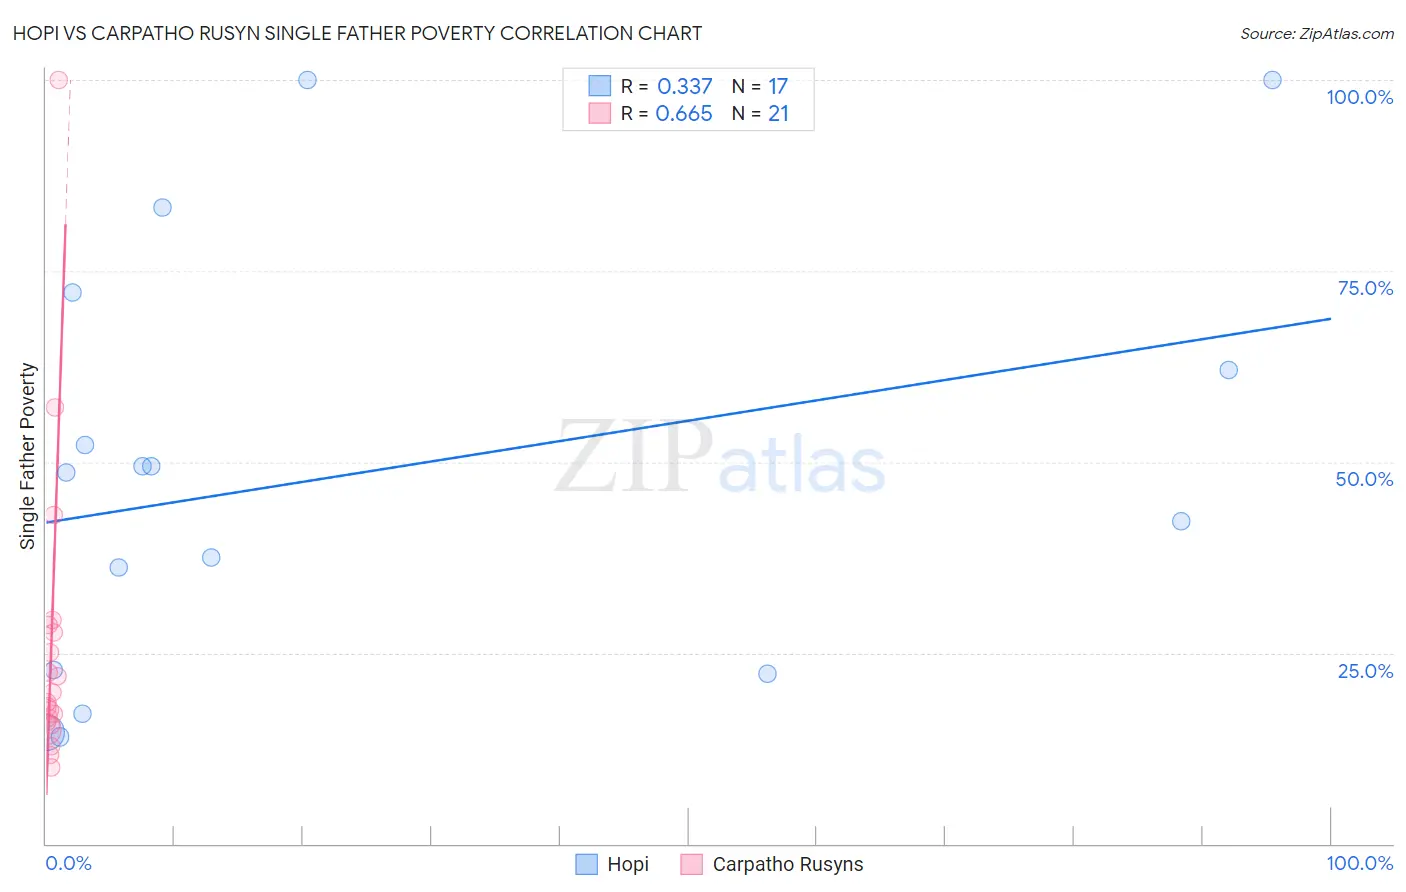
Hopi vs Carpatho Rusyn Single Father Poverty Correlation Chart
The statistical analysis conducted on geographies consisting of 69,635,854 people shows a mild positive correlation between the proportion of Hopi and poverty level among single fathers in the United States with a correlation coefficient (R) of 0.337 and weighted average of 27.2%. Similarly, the statistical analysis conducted on geographies consisting of 53,631,013 people shows a significant positive correlation between the proportion of Carpatho Rusyns and poverty level among single fathers in the United States with a correlation coefficient (R) of 0.665 and weighted average of 18.0%, a difference of 51.2%.
Single Father Poverty Correlation Summary
| Measurement | Hopi | Carpatho Rusyn |
| Minimum | 14.0% | 10.0% |
| Maximum | 100.0% | 100.0% |
| Range | 86.0% | 90.0% |
| Mean | 48.4% | 25.9% |
| Median | 48.6% | 18.6% |
| Interquartile 25% (IQ1) | 22.5% | 15.7% |
| Interquartile 75% (IQ3) | 67.1% | 28.1% |
| Interquartile Range (IQR) | 44.7% | 12.4% |
| Standard Deviation (Sample) | 27.7% | 20.2% |
| Standard Deviation (Population) | 26.9% | 19.7% |
Similar Demographics by Single Father Poverty
Demographics Similar to Hopi by Single Father Poverty
In terms of single father poverty, the demographic groups most similar to Hopi are Houma (26.7%, a difference of 1.6%), Yuman (28.4%, a difference of 4.5%), Lumbee (28.5%, a difference of 4.9%), Navajo (29.2%, a difference of 7.6%), and Crow (30.3%, a difference of 11.5%).
| Demographics | Rating | Rank | Single Father Poverty |
| Natives/Alaskans | 0.0 /100 | #333 | Tragic 22.4% |
| Kiowa | 0.0 /100 | #334 | Tragic 22.5% |
| Shoshone | 0.0 /100 | #335 | Tragic 22.9% |
| Cajuns | 0.0 /100 | #336 | Tragic 23.1% |
| Sioux | 0.0 /100 | #337 | Tragic 23.9% |
| Arapaho | 0.0 /100 | #338 | Tragic 24.0% |
| Apache | 0.0 /100 | #339 | Tragic 24.2% |
| Houma | 0.0 /100 | #340 | Tragic 26.7% |
| Hopi | 0.0 /100 | #341 | Tragic 27.2% |
| Yuman | 0.0 /100 | #342 | Tragic 28.4% |
| Lumbee | 0.0 /100 | #343 | Tragic 28.5% |
| Navajo | 0.0 /100 | #344 | Tragic 29.2% |
| Crow | 0.0 /100 | #345 | Tragic 30.3% |
| Puerto Ricans | 0.0 /100 | #346 | Tragic 31.5% |
| Yup'ik | 0.0 /100 | #347 | Tragic 32.5% |
Demographics Similar to Carpatho Rusyns by Single Father Poverty
In terms of single father poverty, the demographic groups most similar to Carpatho Rusyns are Bahamian (18.0%, a difference of 0.020%), Immigrants from North Macedonia (17.9%, a difference of 0.22%), Immigrants from Lebanon (17.9%, a difference of 0.40%), Irish (18.0%, a difference of 0.46%), and West Indian (18.0%, a difference of 0.49%).
| Demographics | Rating | Rank | Single Father Poverty |
| Scottish | 0.0 /100 | #280 | Tragic 17.7% |
| English | 0.0 /100 | #281 | Tragic 17.8% |
| Dutch | 0.0 /100 | #282 | Tragic 17.8% |
| Alsatians | 0.0 /100 | #283 | Tragic 17.8% |
| Welsh | 0.0 /100 | #284 | Tragic 17.8% |
| Immigrants | Lebanon | 0.0 /100 | #285 | Tragic 17.9% |
| Immigrants | North Macedonia | 0.0 /100 | #286 | Tragic 17.9% |
| Carpatho Rusyns | 0.0 /100 | #287 | Tragic 18.0% |
| Bahamians | 0.0 /100 | #288 | Tragic 18.0% |
| Irish | 0.0 /100 | #289 | Tragic 18.0% |
| West Indians | 0.0 /100 | #290 | Tragic 18.0% |
| Alaskan Athabascans | 0.0 /100 | #291 | Tragic 18.1% |
| Immigrants | Bahamas | 0.0 /100 | #292 | Tragic 18.1% |
| Alaska Natives | 0.0 /100 | #293 | Tragic 18.1% |
| U.S. Virgin Islanders | 0.0 /100 | #294 | Tragic 18.1% |