Mexican American Indian vs Indonesian Female Poverty
COMPARE
Mexican American Indian
Indonesian
Female Poverty
Female Poverty Comparison
Mexican American Indians
Indonesians
15.6%
FEMALE POVERTY
0.1/ 100
METRIC RATING
262nd/ 347
METRIC RANK
16.4%
FEMALE POVERTY
0.0/ 100
METRIC RATING
288th/ 347
METRIC RANK
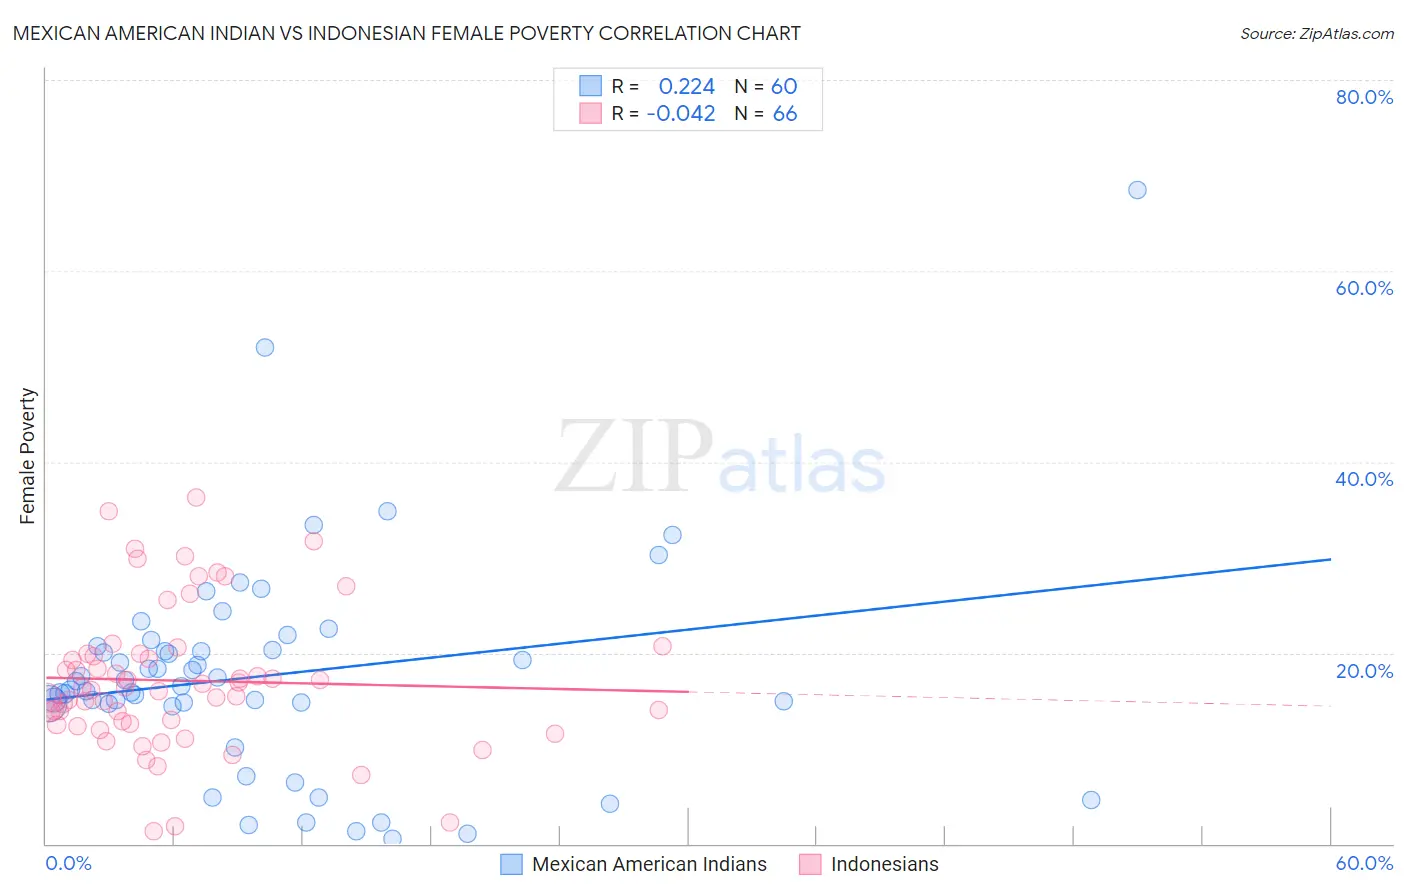
Mexican American Indian vs Indonesian Female Poverty Correlation Chart
The statistical analysis conducted on geographies consisting of 317,470,286 people shows a weak positive correlation between the proportion of Mexican American Indians and poverty level among females in the United States with a correlation coefficient (R) of 0.224 and weighted average of 15.6%. Similarly, the statistical analysis conducted on geographies consisting of 162,639,231 people shows no correlation between the proportion of Indonesians and poverty level among females in the United States with a correlation coefficient (R) of -0.042 and weighted average of 16.4%, a difference of 4.8%.
Female Poverty Correlation Summary
| Measurement | Mexican American Indian | Indonesian |
| Minimum | 0.49% | 1.3% |
| Maximum | 68.4% | 36.2% |
| Range | 67.9% | 34.9% |
| Mean | 17.6% | 17.1% |
| Median | 16.8% | 16.2% |
| Interquartile 25% (IQ1) | 14.7% | 12.6% |
| Interquartile 75% (IQ3) | 20.5% | 19.8% |
| Interquartile Range (IQR) | 5.8% | 7.3% |
| Standard Deviation (Sample) | 11.5% | 7.4% |
| Standard Deviation (Population) | 11.4% | 7.4% |
Similar Demographics by Female Poverty
Demographics Similar to Mexican American Indians by Female Poverty
In terms of female poverty, the demographic groups most similar to Mexican American Indians are Guyanese (15.6%, a difference of 0.0%), Cherokee (15.6%, a difference of 0.010%), Immigrants from Guyana (15.6%, a difference of 0.10%), Immigrants from Ecuador (15.6%, a difference of 0.14%), and Cape Verdean (15.6%, a difference of 0.18%).
| Demographics | Rating | Rank | Female Poverty |
| Ottawa | 0.2 /100 | #255 | Tragic 15.5% |
| Jamaicans | 0.2 /100 | #256 | Tragic 15.5% |
| Immigrants | Jamaica | 0.1 /100 | #257 | Tragic 15.6% |
| Shoshone | 0.1 /100 | #258 | Tragic 15.6% |
| Cape Verdeans | 0.1 /100 | #259 | Tragic 15.6% |
| Immigrants | Guyana | 0.1 /100 | #260 | Tragic 15.6% |
| Guyanese | 0.1 /100 | #261 | Tragic 15.6% |
| Mexican American Indians | 0.1 /100 | #262 | Tragic 15.6% |
| Cherokee | 0.1 /100 | #263 | Tragic 15.6% |
| Immigrants | Ecuador | 0.1 /100 | #264 | Tragic 15.6% |
| Immigrants | Liberia | 0.1 /100 | #265 | Tragic 15.7% |
| Immigrants | El Salvador | 0.1 /100 | #266 | Tragic 15.7% |
| Sub-Saharan Africans | 0.1 /100 | #267 | Tragic 15.8% |
| Immigrants | Nicaragua | 0.1 /100 | #268 | Tragic 15.8% |
| Iroquois | 0.1 /100 | #269 | Tragic 15.8% |
Demographics Similar to Indonesians by Female Poverty
In terms of female poverty, the demographic groups most similar to Indonesians are Blackfeet (16.4%, a difference of 0.010%), Immigrants from Bangladesh (16.4%, a difference of 0.20%), Yaqui (16.4%, a difference of 0.37%), Immigrants from Zaire (16.4%, a difference of 0.38%), and Immigrants from Latin America (16.4%, a difference of 0.43%).
| Demographics | Rating | Rank | Female Poverty |
| West Indians | 0.0 /100 | #281 | Tragic 16.1% |
| Immigrants | Haiti | 0.0 /100 | #282 | Tragic 16.1% |
| Immigrants | Cuba | 0.0 /100 | #283 | Tragic 16.1% |
| Spanish Americans | 0.0 /100 | #284 | Tragic 16.2% |
| Comanche | 0.0 /100 | #285 | Tragic 16.2% |
| Inupiat | 0.0 /100 | #286 | Tragic 16.2% |
| Immigrants | Belize | 0.0 /100 | #287 | Tragic 16.3% |
| Indonesians | 0.0 /100 | #288 | Tragic 16.4% |
| Blackfeet | 0.0 /100 | #289 | Tragic 16.4% |
| Immigrants | Bangladesh | 0.0 /100 | #290 | Tragic 16.4% |
| Yaqui | 0.0 /100 | #291 | Tragic 16.4% |
| Immigrants | Zaire | 0.0 /100 | #292 | Tragic 16.4% |
| Immigrants | Latin America | 0.0 /100 | #293 | Tragic 16.4% |
| Immigrants | Cabo Verde | 0.0 /100 | #294 | Tragic 16.4% |
| Senegalese | 0.0 /100 | #295 | Tragic 16.5% |