Honduran vs Thai In Labor Force | Age 35-44
COMPARE
Honduran
Thai
In Labor Force | Age 35-44
In Labor Force | Age 35-44 Comparison
Hondurans
Thais
83.4%
IN LABOR FORCE | AGE 35-44
0.1/ 100
METRIC RATING
268th/ 347
METRIC RANK
85.2%
IN LABOR FORCE | AGE 35-44
99.7/ 100
METRIC RATING
50th/ 347
METRIC RANK
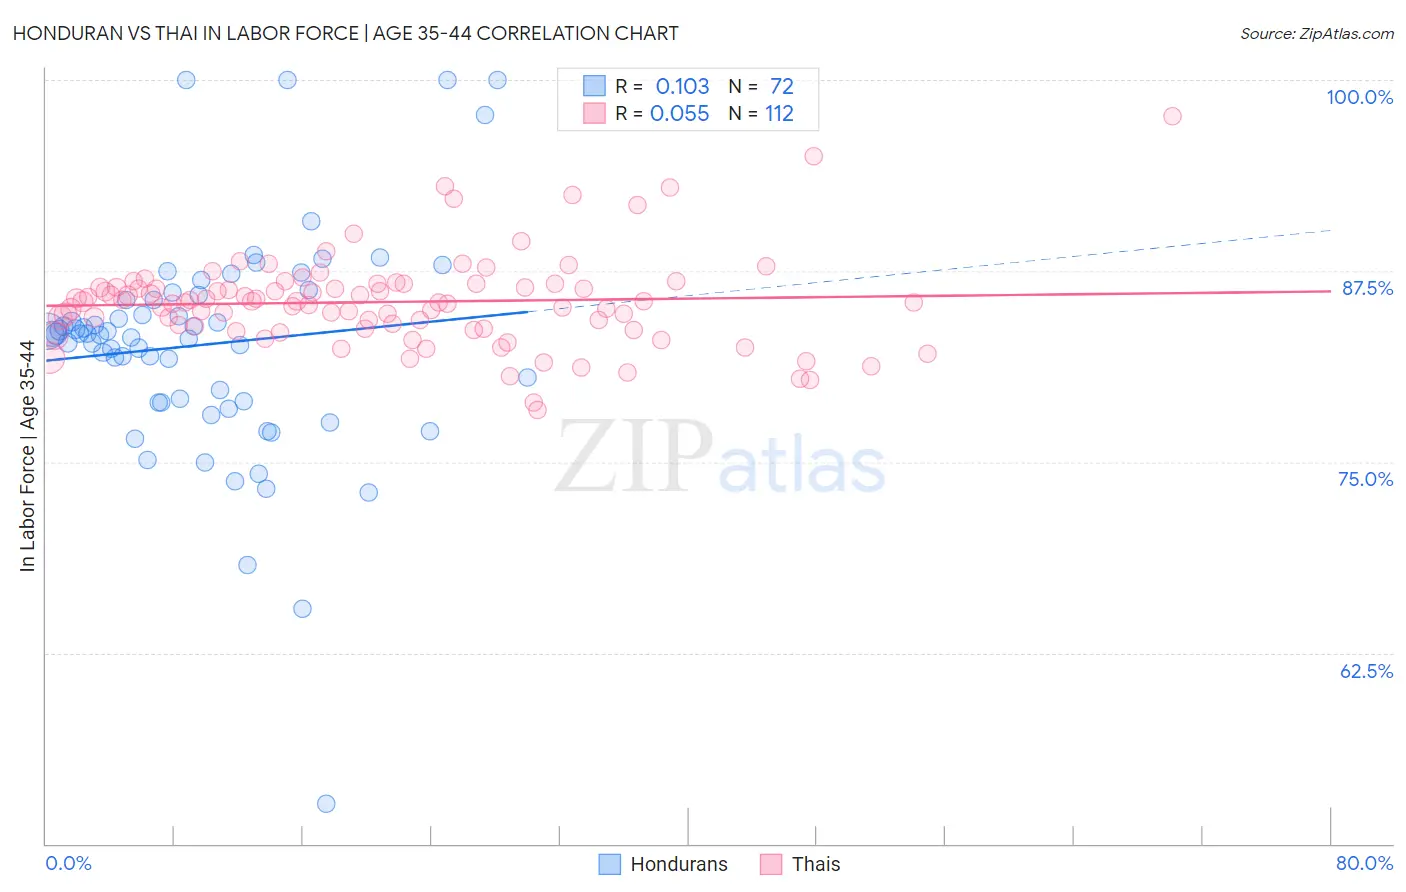
Honduran vs Thai In Labor Force | Age 35-44 Correlation Chart
The statistical analysis conducted on geographies consisting of 357,674,403 people shows a poor positive correlation between the proportion of Hondurans and labor force participation rate among population between the ages 35 and 44 in the United States with a correlation coefficient (R) of 0.103 and weighted average of 83.4%. Similarly, the statistical analysis conducted on geographies consisting of 475,470,892 people shows a slight positive correlation between the proportion of Thais and labor force participation rate among population between the ages 35 and 44 in the United States with a correlation coefficient (R) of 0.055 and weighted average of 85.2%, a difference of 2.1%.
In Labor Force | Age 35-44 Correlation Summary
| Measurement | Honduran | Thai |
| Minimum | 52.6% | 78.4% |
| Maximum | 100.0% | 97.6% |
| Range | 47.4% | 19.2% |
| Mean | 82.7% | 85.5% |
| Median | 83.4% | 85.5% |
| Interquartile 25% (IQ1) | 79.0% | 83.8% |
| Interquartile 75% (IQ3) | 85.8% | 86.5% |
| Interquartile Range (IQR) | 6.8% | 2.7% |
| Standard Deviation (Sample) | 7.5% | 3.0% |
| Standard Deviation (Population) | 7.4% | 3.0% |
Similar Demographics by In Labor Force | Age 35-44
Demographics Similar to Hondurans by In Labor Force | Age 35-44
In terms of in labor force | age 35-44, the demographic groups most similar to Hondurans are Immigrants from Grenada (83.3%, a difference of 0.010%), Guamanian/Chamorro (83.4%, a difference of 0.030%), Spaniard (83.4%, a difference of 0.080%), Scotch-Irish (83.5%, a difference of 0.12%), and Central American (83.5%, a difference of 0.12%).
| Demographics | Rating | Rank | In Labor Force | Age 35-44 |
| Immigrants | Dominica | 0.2 /100 | #261 | Tragic 83.5% |
| Immigrants | Congo | 0.2 /100 | #262 | Tragic 83.5% |
| Iroquois | 0.2 /100 | #263 | Tragic 83.5% |
| Scotch-Irish | 0.1 /100 | #264 | Tragic 83.5% |
| Central Americans | 0.1 /100 | #265 | Tragic 83.5% |
| Spaniards | 0.1 /100 | #266 | Tragic 83.4% |
| Guamanians/Chamorros | 0.1 /100 | #267 | Tragic 83.4% |
| Hondurans | 0.1 /100 | #268 | Tragic 83.4% |
| Immigrants | Grenada | 0.1 /100 | #269 | Tragic 83.3% |
| Immigrants | Honduras | 0.0 /100 | #270 | Tragic 83.3% |
| French American Indians | 0.0 /100 | #271 | Tragic 83.2% |
| Immigrants | Fiji | 0.0 /100 | #272 | Tragic 83.2% |
| Spanish | 0.0 /100 | #273 | Tragic 83.2% |
| Immigrants | Nonimmigrants | 0.0 /100 | #274 | Tragic 83.2% |
| Hawaiians | 0.0 /100 | #275 | Tragic 83.2% |
Demographics Similar to Thais by In Labor Force | Age 35-44
In terms of in labor force | age 35-44, the demographic groups most similar to Thais are Immigrants from Albania (85.1%, a difference of 0.0%), Immigrants from Eritrea (85.2%, a difference of 0.030%), Croatian (85.2%, a difference of 0.030%), German Russian (85.2%, a difference of 0.040%), and Immigrants from Kenya (85.1%, a difference of 0.040%).
| Demographics | Rating | Rank | In Labor Force | Age 35-44 |
| Poles | 99.8 /100 | #43 | Exceptional 85.2% |
| Lithuanians | 99.8 /100 | #44 | Exceptional 85.2% |
| Cypriots | 99.8 /100 | #45 | Exceptional 85.2% |
| Immigrants | Hong Kong | 99.8 /100 | #46 | Exceptional 85.2% |
| German Russians | 99.8 /100 | #47 | Exceptional 85.2% |
| Immigrants | Eritrea | 99.7 /100 | #48 | Exceptional 85.2% |
| Croatians | 99.7 /100 | #49 | Exceptional 85.2% |
| Thais | 99.7 /100 | #50 | Exceptional 85.2% |
| Immigrants | Albania | 99.7 /100 | #51 | Exceptional 85.1% |
| Immigrants | Kenya | 99.6 /100 | #52 | Exceptional 85.1% |
| Taiwanese | 99.6 /100 | #53 | Exceptional 85.1% |
| Turks | 99.5 /100 | #54 | Exceptional 85.1% |
| Soviet Union | 99.5 /100 | #55 | Exceptional 85.1% |
| Immigrants | Croatia | 99.5 /100 | #56 | Exceptional 85.1% |
| Chinese | 99.4 /100 | #57 | Exceptional 85.1% |