Liberian vs Central American Indian Female Poverty
COMPARE
Liberian
Central American Indian
Female Poverty
Female Poverty Comparison
Liberians
Central American Indians
15.4%
FEMALE POVERTY
0.2/ 100
METRIC RATING
253rd/ 347
METRIC RANK
18.0%
FEMALE POVERTY
0.0/ 100
METRIC RATING
326th/ 347
METRIC RANK
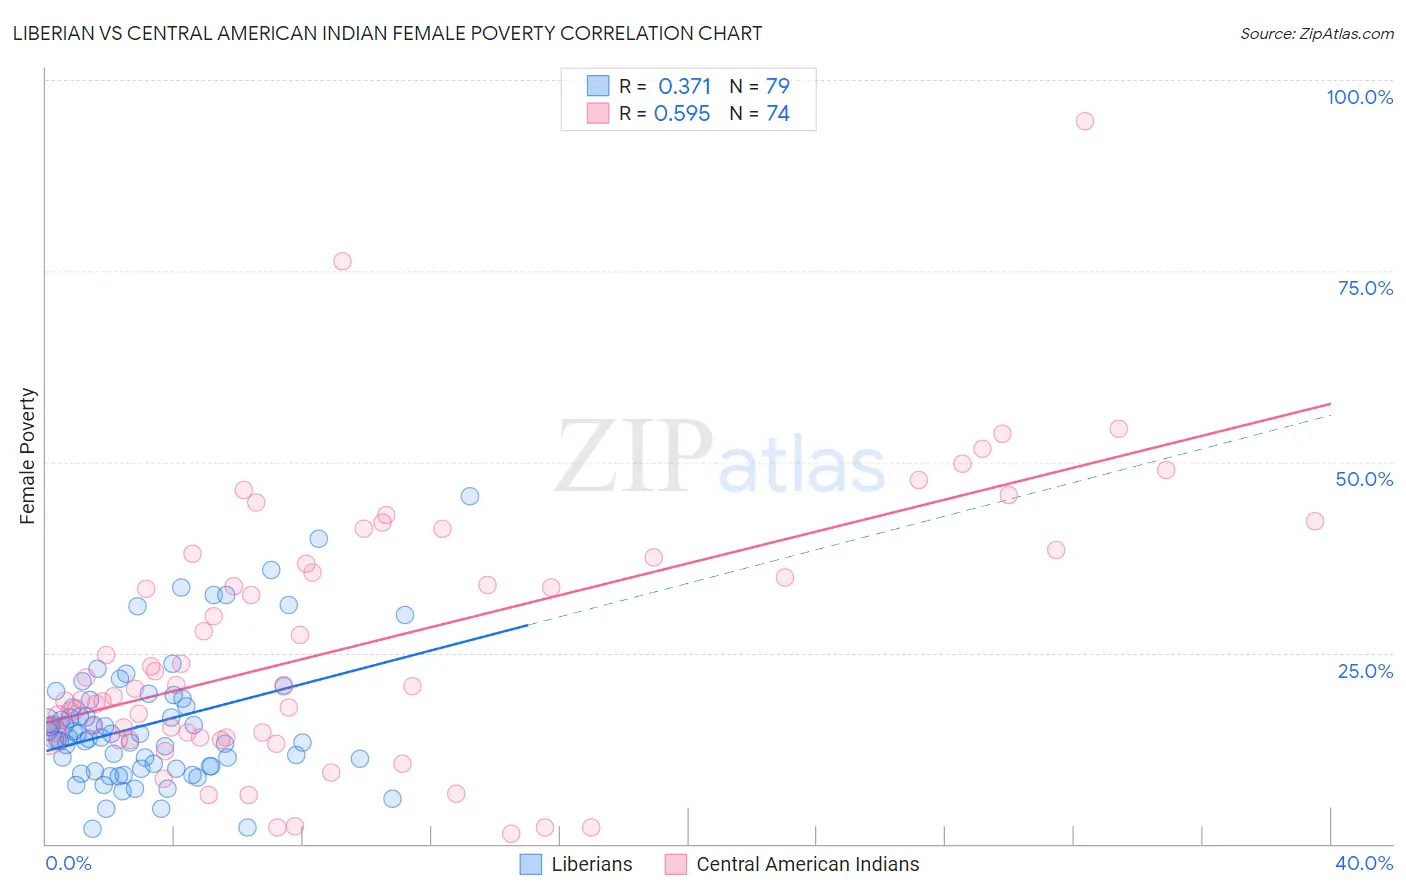
Liberian vs Central American Indian Female Poverty Correlation Chart
The statistical analysis conducted on geographies consisting of 118,038,056 people shows a mild positive correlation between the proportion of Liberians and poverty level among females in the United States with a correlation coefficient (R) of 0.371 and weighted average of 15.4%. Similarly, the statistical analysis conducted on geographies consisting of 326,040,737 people shows a substantial positive correlation between the proportion of Central American Indians and poverty level among females in the United States with a correlation coefficient (R) of 0.595 and weighted average of 18.0%, a difference of 17.0%.
Female Poverty Correlation Summary
| Measurement | Liberian | Central American Indian |
| Minimum | 1.9% | 1.4% |
| Maximum | 45.5% | 94.5% |
| Range | 43.6% | 93.2% |
| Mean | 15.7% | 26.1% |
| Median | 14.0% | 20.8% |
| Interquartile 25% (IQ1) | 10.2% | 14.1% |
| Interquartile 75% (IQ3) | 18.8% | 37.5% |
| Interquartile Range (IQR) | 8.6% | 23.4% |
| Standard Deviation (Sample) | 8.4% | 17.4% |
| Standard Deviation (Population) | 8.3% | 17.3% |
Similar Demographics by Female Poverty
Demographics Similar to Liberians by Female Poverty
In terms of female poverty, the demographic groups most similar to Liberians are Trinidadian and Tobagonian (15.4%, a difference of 0.24%), Immigrants from Burma/Myanmar (15.4%, a difference of 0.26%), Immigrants from Trinidad and Tobago (15.4%, a difference of 0.30%), Immigrants from Western Africa (15.3%, a difference of 0.45%), and Salvadoran (15.3%, a difference of 0.50%).
| Demographics | Rating | Rank | Female Poverty |
| Cubans | 0.3 /100 | #246 | Tragic 15.3% |
| Potawatomi | 0.3 /100 | #247 | Tragic 15.3% |
| Immigrants | Ghana | 0.3 /100 | #248 | Tragic 15.3% |
| Salvadorans | 0.3 /100 | #249 | Tragic 15.3% |
| Immigrants | Western Africa | 0.3 /100 | #250 | Tragic 15.3% |
| Immigrants | Trinidad and Tobago | 0.3 /100 | #251 | Tragic 15.4% |
| Immigrants | Burma/Myanmar | 0.3 /100 | #252 | Tragic 15.4% |
| Liberians | 0.2 /100 | #253 | Tragic 15.4% |
| Trinidadians and Tobagonians | 0.2 /100 | #254 | Tragic 15.4% |
| Ottawa | 0.2 /100 | #255 | Tragic 15.5% |
| Jamaicans | 0.2 /100 | #256 | Tragic 15.5% |
| Immigrants | Jamaica | 0.1 /100 | #257 | Tragic 15.6% |
| Shoshone | 0.1 /100 | #258 | Tragic 15.6% |
| Cape Verdeans | 0.1 /100 | #259 | Tragic 15.6% |
| Immigrants | Guyana | 0.1 /100 | #260 | Tragic 15.6% |
Demographics Similar to Central American Indians by Female Poverty
In terms of female poverty, the demographic groups most similar to Central American Indians are Yakama (18.0%, a difference of 0.10%), Colville (17.8%, a difference of 1.5%), Immigrants from Honduras (17.7%, a difference of 1.7%), Paiute (17.7%, a difference of 1.9%), and Menominee (17.6%, a difference of 2.5%).
| Demographics | Rating | Rank | Female Poverty |
| Cajuns | 0.0 /100 | #319 | Tragic 17.5% |
| Immigrants | Dominica | 0.0 /100 | #320 | Tragic 17.5% |
| Arapaho | 0.0 /100 | #321 | Tragic 17.5% |
| Menominee | 0.0 /100 | #322 | Tragic 17.6% |
| Paiute | 0.0 /100 | #323 | Tragic 17.7% |
| Immigrants | Honduras | 0.0 /100 | #324 | Tragic 17.7% |
| Colville | 0.0 /100 | #325 | Tragic 17.8% |
| Central American Indians | 0.0 /100 | #326 | Tragic 18.0% |
| Yakama | 0.0 /100 | #327 | Tragic 18.0% |
| Blacks/African Americans | 0.0 /100 | #328 | Tragic 18.6% |
| Kiowa | 0.0 /100 | #329 | Tragic 18.6% |
| Dominicans | 0.0 /100 | #330 | Tragic 19.1% |
| Natives/Alaskans | 0.0 /100 | #331 | Tragic 19.2% |
| Apache | 0.0 /100 | #332 | Tragic 19.2% |
| Immigrants | Dominican Republic | 0.0 /100 | #333 | Tragic 19.3% |