Hispanic or Latino vs Chilean Female Poverty
COMPARE
Hispanic or Latino
Chilean
Female Poverty
Female Poverty Comparison
Hispanics or Latinos
Chileans
16.6%
FEMALE POVERTY
0.0/ 100
METRIC RATING
299th/ 347
METRIC RANK
12.9%
FEMALE POVERTY
84.7/ 100
METRIC RATING
137th/ 347
METRIC RANK
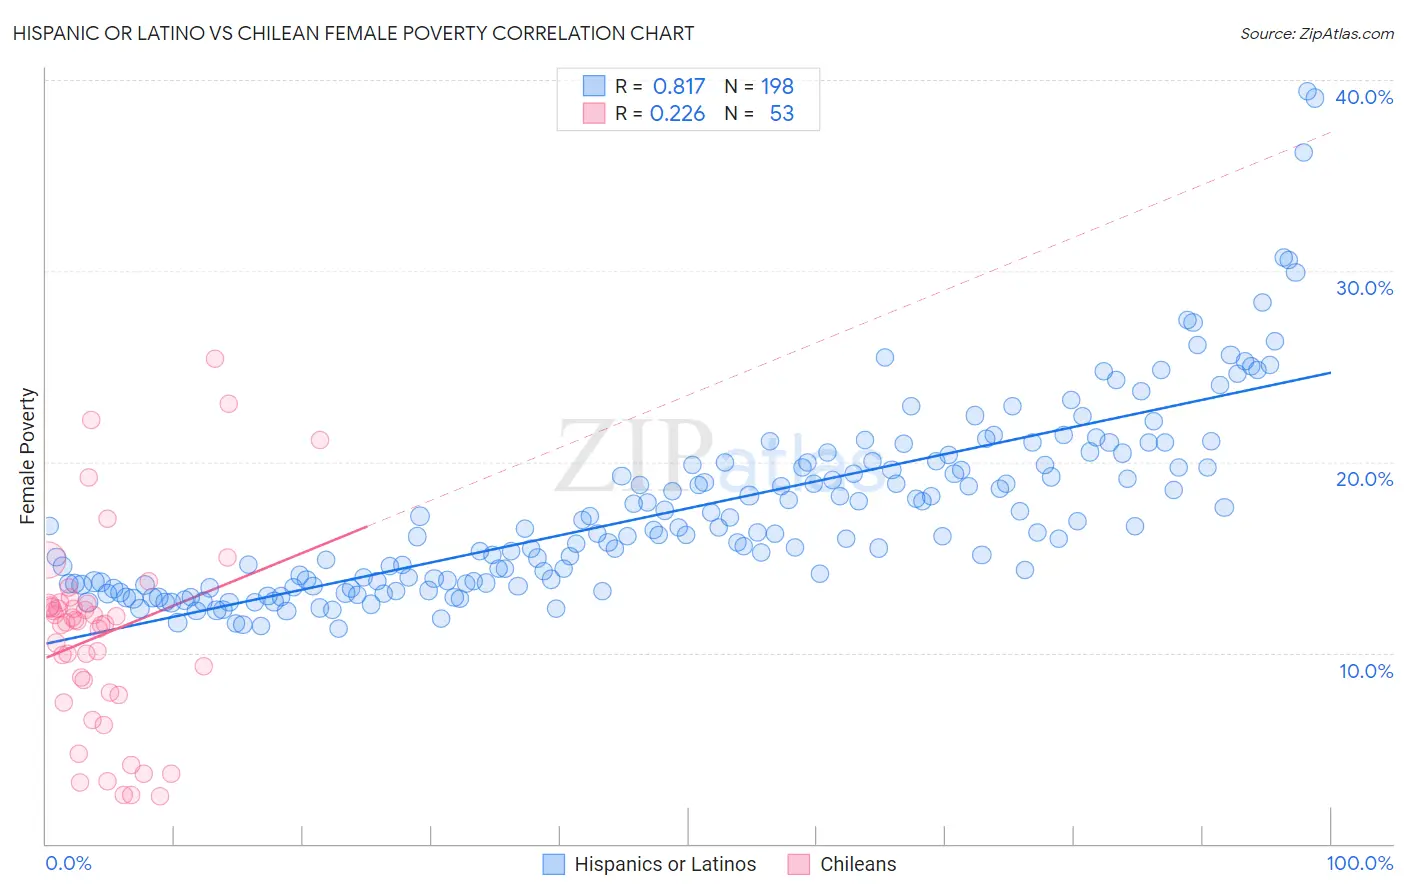
Hispanic or Latino vs Chilean Female Poverty Correlation Chart
The statistical analysis conducted on geographies consisting of 574,030,648 people shows a very strong positive correlation between the proportion of Hispanics or Latinos and poverty level among females in the United States with a correlation coefficient (R) of 0.817 and weighted average of 16.6%. Similarly, the statistical analysis conducted on geographies consisting of 256,534,344 people shows a weak positive correlation between the proportion of Chileans and poverty level among females in the United States with a correlation coefficient (R) of 0.226 and weighted average of 12.9%, a difference of 29.1%.
Female Poverty Correlation Summary
| Measurement | Hispanic or Latino | Chilean |
| Minimum | 11.3% | 2.5% |
| Maximum | 39.4% | 25.4% |
| Range | 28.1% | 22.9% |
| Mean | 17.5% | 11.0% |
| Median | 16.3% | 11.6% |
| Interquartile 25% (IQ1) | 13.6% | 7.8% |
| Interquartile 75% (IQ3) | 19.8% | 12.5% |
| Interquartile Range (IQR) | 6.2% | 4.7% |
| Standard Deviation (Sample) | 5.0% | 5.2% |
| Standard Deviation (Population) | 5.0% | 5.1% |
Similar Demographics by Female Poverty
Demographics Similar to Hispanics or Latinos by Female Poverty
In terms of female poverty, the demographic groups most similar to Hispanics or Latinos are Bahamian (16.6%, a difference of 0.040%), Guatemalan (16.7%, a difference of 0.38%), Chippewa (16.7%, a difference of 0.40%), Somali (16.6%, a difference of 0.52%), and Mexican (16.5%, a difference of 0.73%).
| Demographics | Rating | Rank | Female Poverty |
| Immigrants | Zaire | 0.0 /100 | #292 | Tragic 16.4% |
| Immigrants | Latin America | 0.0 /100 | #293 | Tragic 16.4% |
| Immigrants | Cabo Verde | 0.0 /100 | #294 | Tragic 16.4% |
| Senegalese | 0.0 /100 | #295 | Tragic 16.5% |
| Immigrants | Senegal | 0.0 /100 | #296 | Tragic 16.5% |
| Mexicans | 0.0 /100 | #297 | Tragic 16.5% |
| Somalis | 0.0 /100 | #298 | Tragic 16.6% |
| Hispanics or Latinos | 0.0 /100 | #299 | Tragic 16.6% |
| Bahamians | 0.0 /100 | #300 | Tragic 16.6% |
| Guatemalans | 0.0 /100 | #301 | Tragic 16.7% |
| Chippewa | 0.0 /100 | #302 | Tragic 16.7% |
| Choctaw | 0.0 /100 | #303 | Tragic 16.8% |
| Immigrants | Central America | 0.0 /100 | #304 | Tragic 16.8% |
| Immigrants | Grenada | 0.0 /100 | #305 | Tragic 16.8% |
| Immigrants | Caribbean | 0.0 /100 | #306 | Tragic 16.9% |
Demographics Similar to Chileans by Female Poverty
In terms of female poverty, the demographic groups most similar to Chileans are Peruvian (12.9%, a difference of 0.090%), French (12.9%, a difference of 0.17%), Immigrants from Switzerland (12.9%, a difference of 0.22%), Immigrants from France (12.9%, a difference of 0.22%), and Basque (12.9%, a difference of 0.31%).
| Demographics | Rating | Rank | Female Poverty |
| Immigrants | Vietnam | 87.1 /100 | #130 | Excellent 12.8% |
| Immigrants | Argentina | 87.0 /100 | #131 | Excellent 12.8% |
| Immigrants | Jordan | 86.9 /100 | #132 | Excellent 12.8% |
| Immigrants | Western Europe | 86.6 /100 | #133 | Excellent 12.8% |
| Immigrants | Switzerland | 85.8 /100 | #134 | Excellent 12.9% |
| French | 85.6 /100 | #135 | Excellent 12.9% |
| Peruvians | 85.2 /100 | #136 | Excellent 12.9% |
| Chileans | 84.7 /100 | #137 | Excellent 12.9% |
| Immigrants | France | 83.6 /100 | #138 | Excellent 12.9% |
| Basques | 83.1 /100 | #139 | Excellent 12.9% |
| Pakistanis | 83.0 /100 | #140 | Excellent 12.9% |
| Icelanders | 81.1 /100 | #141 | Excellent 13.0% |
| Brazilians | 80.5 /100 | #142 | Excellent 13.0% |
| Immigrants | Malaysia | 80.4 /100 | #143 | Excellent 13.0% |
| Afghans | 79.8 /100 | #144 | Good 13.0% |