Hispanic or Latino vs Immigrants from Romania Family Households
COMPARE
Hispanic or Latino
Immigrants from Romania
Family Households
Family Households Comparison
Hispanics or Latinos
Immigrants from Romania
67.4%
FAMILY HOUSEHOLDS
100.0/ 100
METRIC RATING
27th/ 347
METRIC RANK
64.6%
FAMILY HOUSEHOLDS
77.0/ 100
METRIC RATING
146th/ 347
METRIC RANK
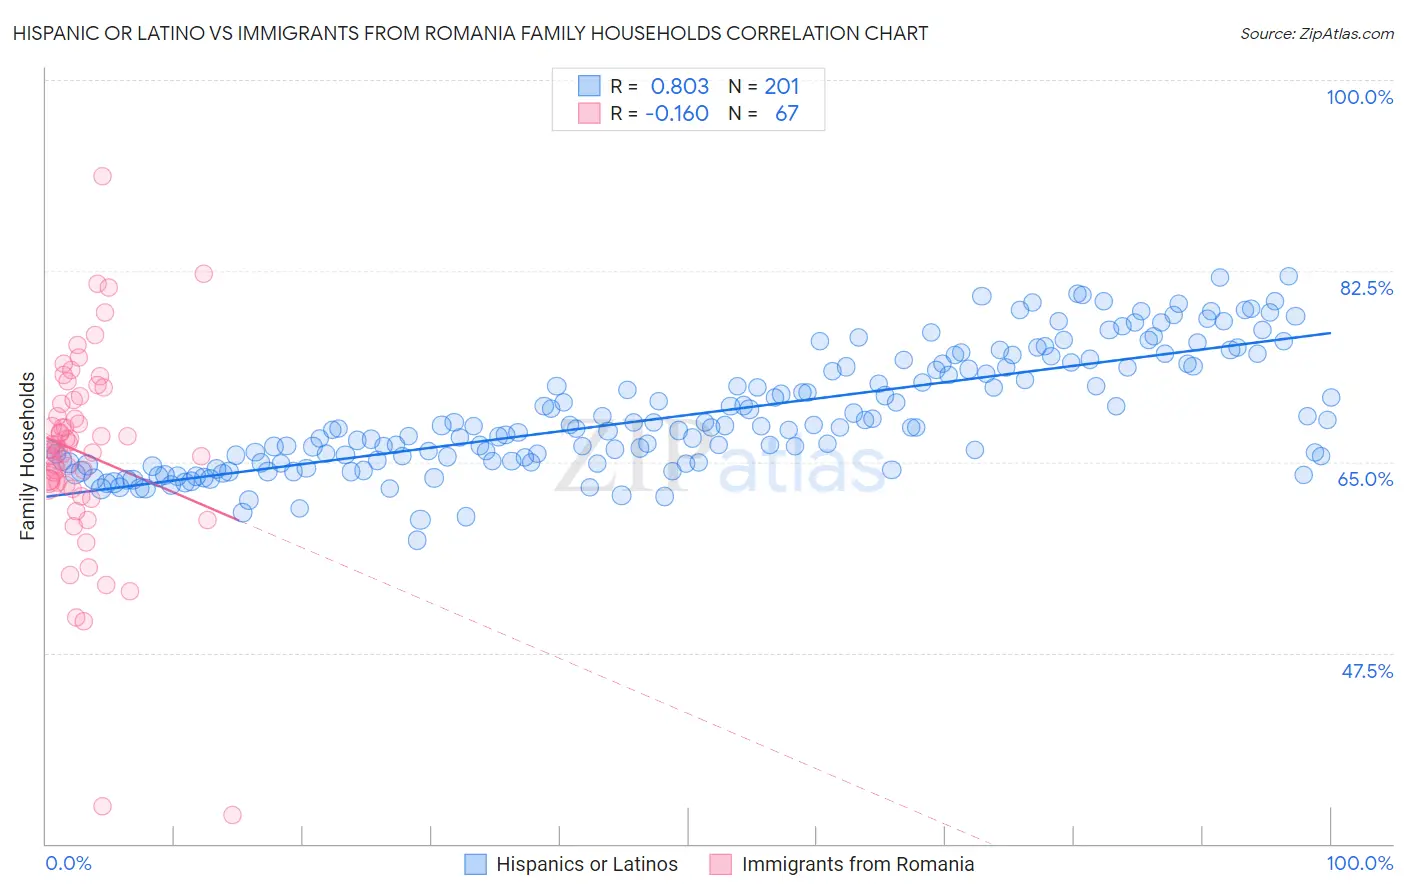
Hispanic or Latino vs Immigrants from Romania Family Households Correlation Chart
The statistical analysis conducted on geographies consisting of 577,913,054 people shows a very strong positive correlation between the proportion of Hispanics or Latinos and percentage of family households in the United States with a correlation coefficient (R) of 0.803 and weighted average of 67.4%. Similarly, the statistical analysis conducted on geographies consisting of 256,963,245 people shows a poor negative correlation between the proportion of Immigrants from Romania and percentage of family households in the United States with a correlation coefficient (R) of -0.160 and weighted average of 64.6%, a difference of 4.4%.
Family Households Correlation Summary
| Measurement | Hispanic or Latino | Immigrants from Romania |
| Minimum | 57.8% | 32.6% |
| Maximum | 82.0% | 91.2% |
| Range | 24.1% | 58.6% |
| Mean | 69.3% | 65.8% |
| Median | 68.2% | 66.2% |
| Interquartile 25% (IQ1) | 65.0% | 62.9% |
| Interquartile 75% (IQ3) | 73.7% | 70.7% |
| Interquartile Range (IQR) | 8.7% | 7.8% |
| Standard Deviation (Sample) | 5.4% | 9.4% |
| Standard Deviation (Population) | 5.4% | 9.3% |
Similar Demographics by Family Households
Demographics Similar to Hispanics or Latinos by Family Households
In terms of family households, the demographic groups most similar to Hispanics or Latinos are Hawaiian (67.4%, a difference of 0.010%), Immigrants from India (67.4%, a difference of 0.040%), Immigrants from Nicaragua (67.5%, a difference of 0.050%), Immigrants from South Eastern Asia (67.5%, a difference of 0.080%), and Nicaraguan (67.4%, a difference of 0.080%).
| Demographics | Rating | Rank | Family Households |
| Inupiat | 100.0 /100 | #20 | Exceptional 67.8% |
| Cubans | 100.0 /100 | #21 | Exceptional 67.7% |
| Sri Lankans | 100.0 /100 | #22 | Exceptional 67.7% |
| Immigrants | Pakistan | 100.0 /100 | #23 | Exceptional 67.7% |
| Immigrants | South Eastern Asia | 100.0 /100 | #24 | Exceptional 67.5% |
| Immigrants | Nicaragua | 100.0 /100 | #25 | Exceptional 67.5% |
| Immigrants | India | 100.0 /100 | #26 | Exceptional 67.4% |
| Hispanics or Latinos | 100.0 /100 | #27 | Exceptional 67.4% |
| Hawaiians | 100.0 /100 | #28 | Exceptional 67.4% |
| Nicaraguans | 100.0 /100 | #29 | Exceptional 67.4% |
| Immigrants | Peru | 100.0 /100 | #30 | Exceptional 67.2% |
| Immigrants | Latin America | 100.0 /100 | #31 | Exceptional 67.2% |
| Nepalese | 100.0 /100 | #32 | Exceptional 67.2% |
| Salvadorans | 100.0 /100 | #33 | Exceptional 67.2% |
| Thais | 100.0 /100 | #34 | Exceptional 67.2% |
Demographics Similar to Immigrants from Romania by Family Households
In terms of family households, the demographic groups most similar to Immigrants from Romania are Immigrants from Chile (64.6%, a difference of 0.010%), Delaware (64.6%, a difference of 0.010%), Sioux (64.6%, a difference of 0.010%), Romanian (64.5%, a difference of 0.030%), and Syrian (64.5%, a difference of 0.030%).
| Demographics | Rating | Rank | Family Households |
| Immigrants | Jamaica | 85.3 /100 | #139 | Excellent 64.7% |
| Immigrants | North Macedonia | 84.9 /100 | #140 | Excellent 64.7% |
| Immigrants | Cameroon | 84.8 /100 | #141 | Excellent 64.7% |
| Pakistanis | 84.0 /100 | #142 | Excellent 64.7% |
| Czechoslovakians | 82.1 /100 | #143 | Excellent 64.6% |
| South American Indians | 81.9 /100 | #144 | Excellent 64.6% |
| Welsh | 80.1 /100 | #145 | Excellent 64.6% |
| Immigrants | Romania | 77.0 /100 | #146 | Good 64.6% |
| Immigrants | Chile | 76.5 /100 | #147 | Good 64.6% |
| Delaware | 76.3 /100 | #148 | Good 64.6% |
| Sioux | 76.3 /100 | #149 | Good 64.6% |
| Romanians | 75.3 /100 | #150 | Good 64.5% |
| Syrians | 75.2 /100 | #151 | Good 64.5% |
| Scottish | 70.9 /100 | #152 | Good 64.5% |
| Swedes | 69.8 /100 | #153 | Good 64.5% |