Hispanic or Latino vs Immigrants from Costa Rica Female Poverty
COMPARE
Hispanic or Latino
Immigrants from Costa Rica
Female Poverty
Female Poverty Comparison
Hispanics or Latinos
Immigrants from Costa Rica
16.6%
FEMALE POVERTY
0.0/ 100
METRIC RATING
299th/ 347
METRIC RANK
13.7%
FEMALE POVERTY
31.9/ 100
METRIC RATING
192nd/ 347
METRIC RANK
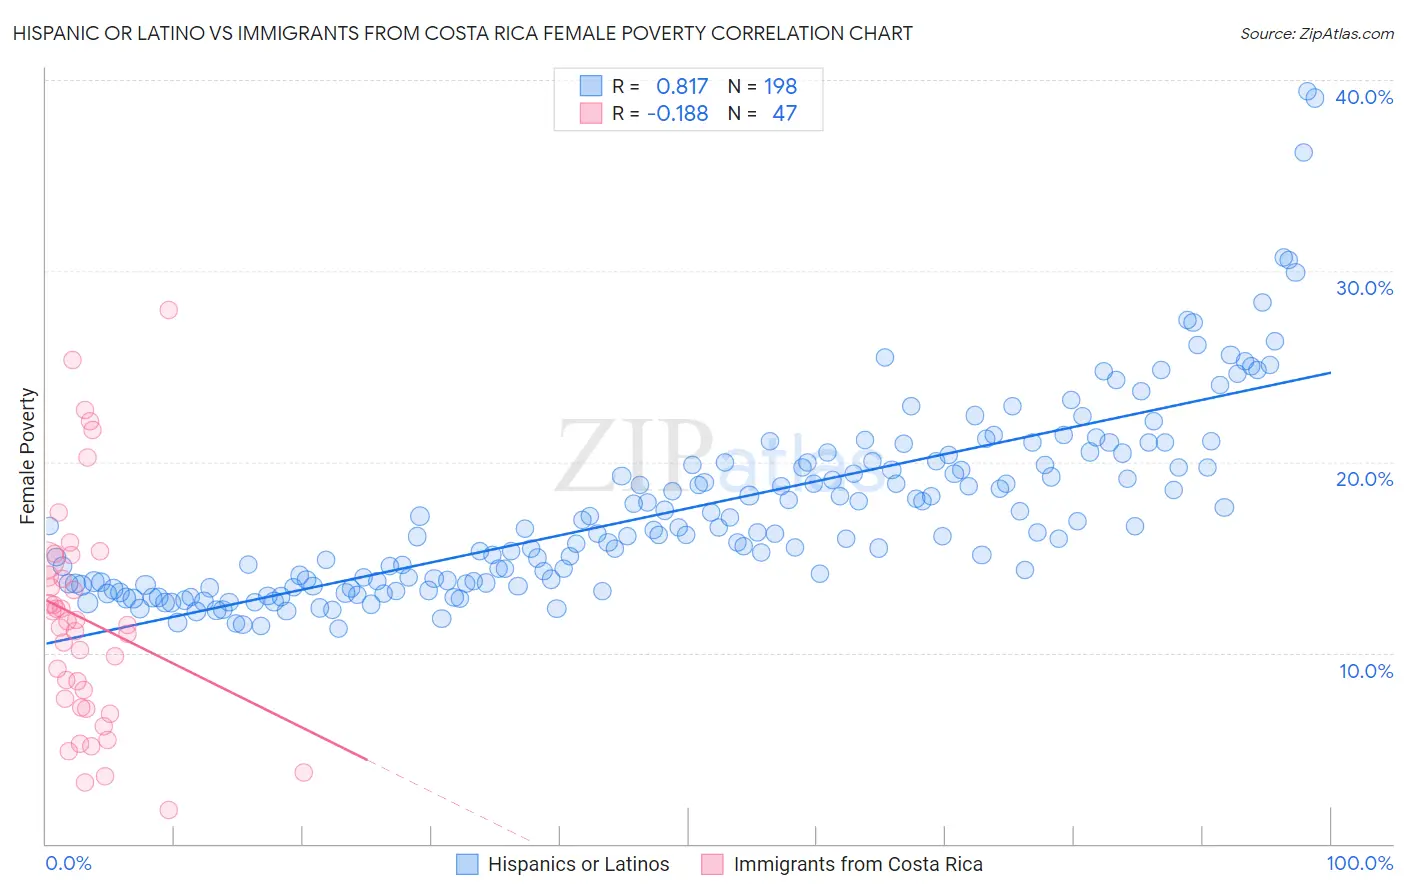
Hispanic or Latino vs Immigrants from Costa Rica Female Poverty Correlation Chart
The statistical analysis conducted on geographies consisting of 574,030,648 people shows a very strong positive correlation between the proportion of Hispanics or Latinos and poverty level among females in the United States with a correlation coefficient (R) of 0.817 and weighted average of 16.6%. Similarly, the statistical analysis conducted on geographies consisting of 204,242,933 people shows a poor negative correlation between the proportion of Immigrants from Costa Rica and poverty level among females in the United States with a correlation coefficient (R) of -0.188 and weighted average of 13.7%, a difference of 21.6%.
Female Poverty Correlation Summary
| Measurement | Hispanic or Latino | Immigrants from Costa Rica |
| Minimum | 11.3% | 1.8% |
| Maximum | 39.4% | 28.0% |
| Range | 28.1% | 26.2% |
| Mean | 17.5% | 11.7% |
| Median | 16.3% | 11.5% |
| Interquartile 25% (IQ1) | 13.6% | 7.1% |
| Interquartile 75% (IQ3) | 19.8% | 14.9% |
| Interquartile Range (IQR) | 6.2% | 7.7% |
| Standard Deviation (Sample) | 5.0% | 5.9% |
| Standard Deviation (Population) | 5.0% | 5.8% |
Similar Demographics by Female Poverty
Demographics Similar to Hispanics or Latinos by Female Poverty
In terms of female poverty, the demographic groups most similar to Hispanics or Latinos are Bahamian (16.6%, a difference of 0.040%), Guatemalan (16.7%, a difference of 0.38%), Chippewa (16.7%, a difference of 0.40%), Somali (16.6%, a difference of 0.52%), and Mexican (16.5%, a difference of 0.73%).
| Demographics | Rating | Rank | Female Poverty |
| Immigrants | Zaire | 0.0 /100 | #292 | Tragic 16.4% |
| Immigrants | Latin America | 0.0 /100 | #293 | Tragic 16.4% |
| Immigrants | Cabo Verde | 0.0 /100 | #294 | Tragic 16.4% |
| Senegalese | 0.0 /100 | #295 | Tragic 16.5% |
| Immigrants | Senegal | 0.0 /100 | #296 | Tragic 16.5% |
| Mexicans | 0.0 /100 | #297 | Tragic 16.5% |
| Somalis | 0.0 /100 | #298 | Tragic 16.6% |
| Hispanics or Latinos | 0.0 /100 | #299 | Tragic 16.6% |
| Bahamians | 0.0 /100 | #300 | Tragic 16.6% |
| Guatemalans | 0.0 /100 | #301 | Tragic 16.7% |
| Chippewa | 0.0 /100 | #302 | Tragic 16.7% |
| Choctaw | 0.0 /100 | #303 | Tragic 16.8% |
| Immigrants | Central America | 0.0 /100 | #304 | Tragic 16.8% |
| Immigrants | Grenada | 0.0 /100 | #305 | Tragic 16.8% |
| Immigrants | Caribbean | 0.0 /100 | #306 | Tragic 16.9% |
Demographics Similar to Immigrants from Costa Rica by Female Poverty
In terms of female poverty, the demographic groups most similar to Immigrants from Costa Rica are Iraqi (13.7%, a difference of 0.020%), Delaware (13.7%, a difference of 0.080%), Immigrants from Kuwait (13.7%, a difference of 0.090%), Sierra Leonean (13.7%, a difference of 0.13%), and Immigrants from South America (13.7%, a difference of 0.14%).
| Demographics | Rating | Rank | Female Poverty |
| Immigrants | Cameroon | 42.0 /100 | #185 | Average 13.5% |
| Immigrants | Portugal | 41.5 /100 | #186 | Average 13.6% |
| Immigrants | Venezuela | 41.0 /100 | #187 | Average 13.6% |
| Hawaiians | 39.9 /100 | #188 | Fair 13.6% |
| Uruguayans | 39.8 /100 | #189 | Fair 13.6% |
| Sierra Leoneans | 33.1 /100 | #190 | Fair 13.7% |
| Immigrants | Kuwait | 32.7 /100 | #191 | Fair 13.7% |
| Immigrants | Costa Rica | 31.9 /100 | #192 | Fair 13.7% |
| Iraqis | 31.8 /100 | #193 | Fair 13.7% |
| Delaware | 31.1 /100 | #194 | Fair 13.7% |
| Immigrants | South America | 30.6 /100 | #195 | Fair 13.7% |
| South American Indians | 28.9 /100 | #196 | Fair 13.7% |
| Arabs | 28.6 /100 | #197 | Fair 13.7% |
| Immigrants | Uganda | 28.5 /100 | #198 | Fair 13.7% |
| Immigrants | Lebanon | 25.6 /100 | #199 | Fair 13.8% |