Hispanic or Latino vs Marshallese Female Poverty
COMPARE
Hispanic or Latino
Marshallese
Female Poverty
Female Poverty Comparison
Hispanics or Latinos
Marshallese
16.6%
FEMALE POVERTY
0.0/ 100
METRIC RATING
299th/ 347
METRIC RANK
14.4%
FEMALE POVERTY
5.0/ 100
METRIC RATING
214th/ 347
METRIC RANK
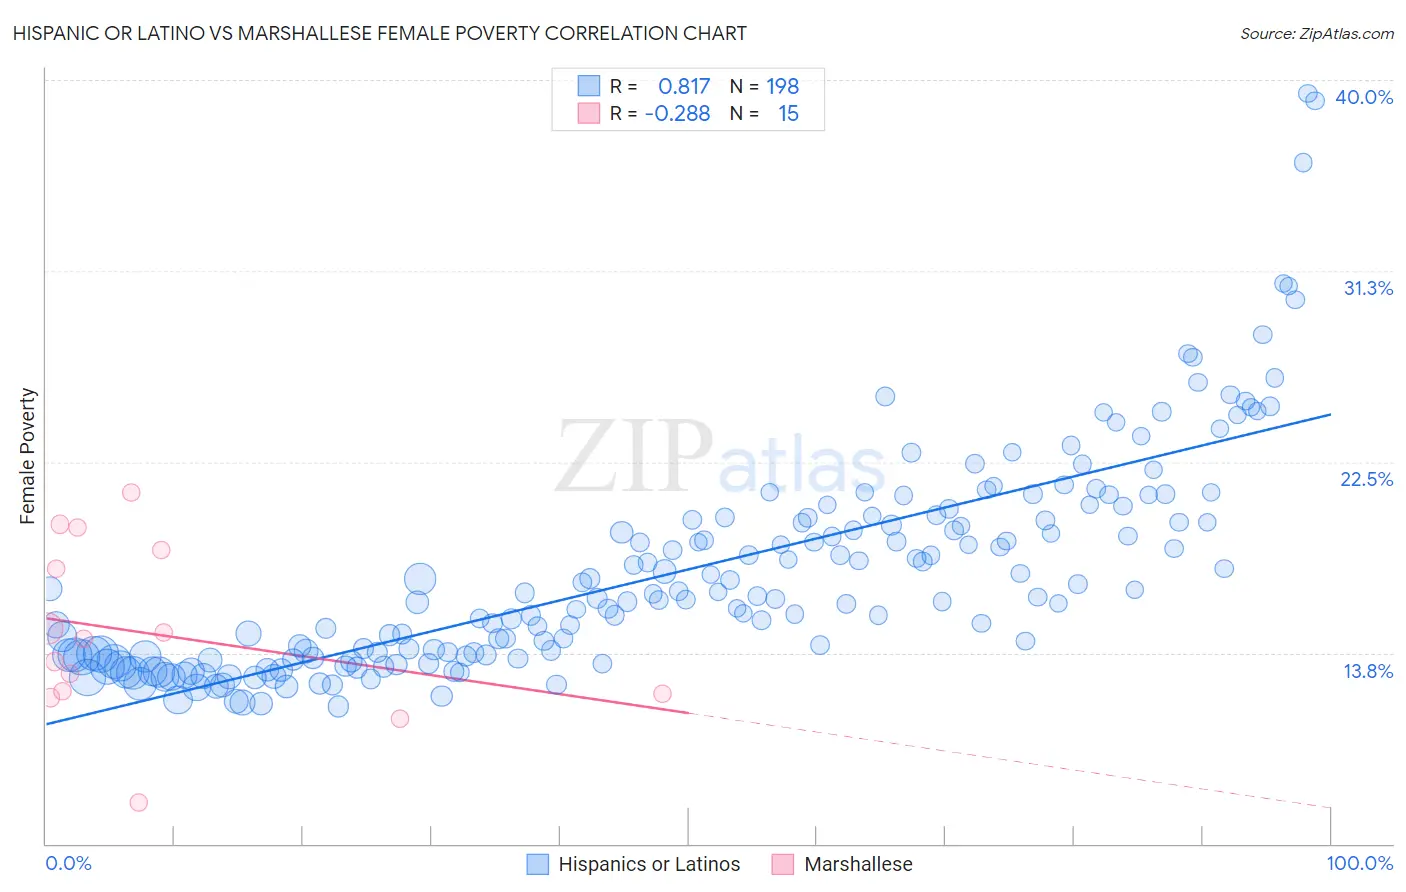
Hispanic or Latino vs Marshallese Female Poverty Correlation Chart
The statistical analysis conducted on geographies consisting of 574,030,648 people shows a very strong positive correlation between the proportion of Hispanics or Latinos and poverty level among females in the United States with a correlation coefficient (R) of 0.817 and weighted average of 16.6%. Similarly, the statistical analysis conducted on geographies consisting of 14,760,991 people shows a weak negative correlation between the proportion of Marshallese and poverty level among females in the United States with a correlation coefficient (R) of -0.288 and weighted average of 14.4%, a difference of 15.6%.
Female Poverty Correlation Summary
| Measurement | Hispanic or Latino | Marshallese |
| Minimum | 11.3% | 6.9% |
| Maximum | 39.4% | 21.1% |
| Range | 28.1% | 14.2% |
| Mean | 17.5% | 14.6% |
| Median | 16.3% | 14.4% |
| Interquartile 25% (IQ1) | 13.6% | 11.9% |
| Interquartile 75% (IQ3) | 19.8% | 18.5% |
| Interquartile Range (IQR) | 6.2% | 6.6% |
| Standard Deviation (Sample) | 5.0% | 3.9% |
| Standard Deviation (Population) | 5.0% | 3.8% |
Similar Demographics by Female Poverty
Demographics Similar to Hispanics or Latinos by Female Poverty
In terms of female poverty, the demographic groups most similar to Hispanics or Latinos are Bahamian (16.6%, a difference of 0.040%), Guatemalan (16.7%, a difference of 0.38%), Chippewa (16.7%, a difference of 0.40%), Somali (16.6%, a difference of 0.52%), and Mexican (16.5%, a difference of 0.73%).
| Demographics | Rating | Rank | Female Poverty |
| Immigrants | Zaire | 0.0 /100 | #292 | Tragic 16.4% |
| Immigrants | Latin America | 0.0 /100 | #293 | Tragic 16.4% |
| Immigrants | Cabo Verde | 0.0 /100 | #294 | Tragic 16.4% |
| Senegalese | 0.0 /100 | #295 | Tragic 16.5% |
| Immigrants | Senegal | 0.0 /100 | #296 | Tragic 16.5% |
| Mexicans | 0.0 /100 | #297 | Tragic 16.5% |
| Somalis | 0.0 /100 | #298 | Tragic 16.6% |
| Hispanics or Latinos | 0.0 /100 | #299 | Tragic 16.6% |
| Bahamians | 0.0 /100 | #300 | Tragic 16.6% |
| Guatemalans | 0.0 /100 | #301 | Tragic 16.7% |
| Chippewa | 0.0 /100 | #302 | Tragic 16.7% |
| Choctaw | 0.0 /100 | #303 | Tragic 16.8% |
| Immigrants | Central America | 0.0 /100 | #304 | Tragic 16.8% |
| Immigrants | Grenada | 0.0 /100 | #305 | Tragic 16.8% |
| Immigrants | Caribbean | 0.0 /100 | #306 | Tragic 16.9% |
Demographics Similar to Marshallese by Female Poverty
In terms of female poverty, the demographic groups most similar to Marshallese are Immigrants from Panama (14.4%, a difference of 0.15%), Alaskan Athabascan (14.4%, a difference of 0.16%), Immigrants from Thailand (14.4%, a difference of 0.23%), Bermudan (14.4%, a difference of 0.24%), and Immigrants (14.4%, a difference of 0.27%).
| Demographics | Rating | Rank | Female Poverty |
| Immigrants | Eastern Africa | 9.0 /100 | #207 | Tragic 14.2% |
| Immigrants | Azores | 7.9 /100 | #208 | Tragic 14.2% |
| Panamanians | 7.7 /100 | #209 | Tragic 14.2% |
| Malaysians | 7.4 /100 | #210 | Tragic 14.3% |
| Moroccans | 7.2 /100 | #211 | Tragic 14.3% |
| Bermudans | 5.5 /100 | #212 | Tragic 14.4% |
| Alaskan Athabascans | 5.3 /100 | #213 | Tragic 14.4% |
| Marshallese | 5.0 /100 | #214 | Tragic 14.4% |
| Immigrants | Panama | 4.7 /100 | #215 | Tragic 14.4% |
| Immigrants | Thailand | 4.5 /100 | #216 | Tragic 14.4% |
| Immigrants | Immigrants | 4.5 /100 | #217 | Tragic 14.4% |
| Immigrants | Uzbekistan | 4.4 /100 | #218 | Tragic 14.4% |
| Japanese | 4.1 /100 | #219 | Tragic 14.5% |
| Alsatians | 4.0 /100 | #220 | Tragic 14.5% |
| Immigrants | Cambodia | 3.7 /100 | #221 | Tragic 14.5% |