Hawaiian vs Immigrants from Ukraine Family Poverty
COMPARE
Hawaiian
Immigrants from Ukraine
Family Poverty
Family Poverty Comparison
Hawaiians
Immigrants from Ukraine
9.0%
FAMILY POVERTY
47.2/ 100
METRIC RATING
177th/ 347
METRIC RANK
8.5%
FAMILY POVERTY
83.9/ 100
METRIC RATING
141st/ 347
METRIC RANK
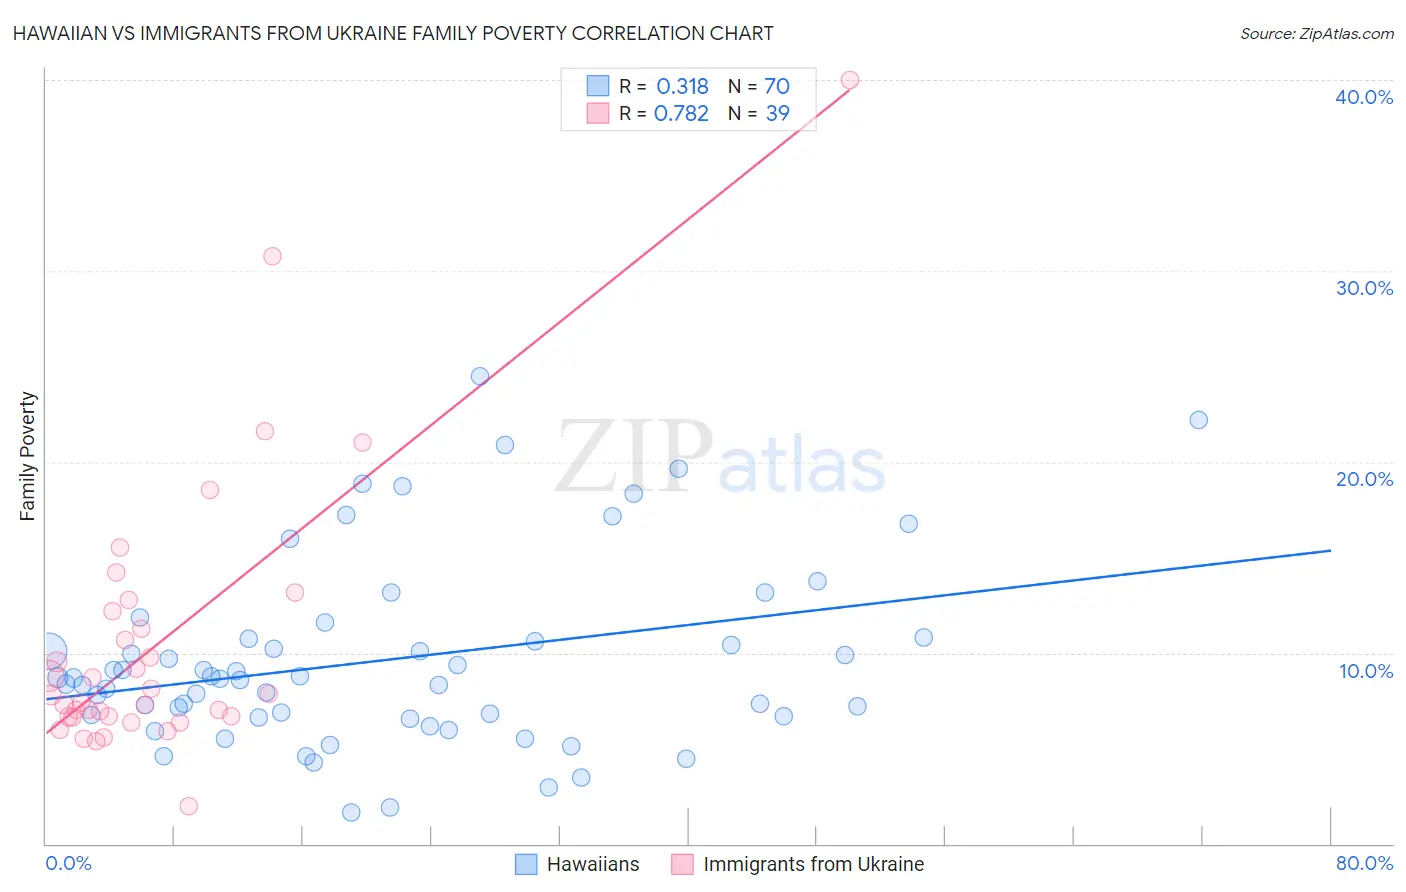
Hawaiian vs Immigrants from Ukraine Family Poverty Correlation Chart
The statistical analysis conducted on geographies consisting of 327,007,125 people shows a mild positive correlation between the proportion of Hawaiians and poverty level among families in the United States with a correlation coefficient (R) of 0.318 and weighted average of 9.0%. Similarly, the statistical analysis conducted on geographies consisting of 289,107,517 people shows a strong positive correlation between the proportion of Immigrants from Ukraine and poverty level among families in the United States with a correlation coefficient (R) of 0.782 and weighted average of 8.5%, a difference of 6.1%.
Family Poverty Correlation Summary
| Measurement | Hawaiian | Immigrants from Ukraine |
| Minimum | 1.6% | 2.0% |
| Maximum | 24.5% | 40.0% |
| Range | 22.9% | 38.0% |
| Mean | 9.6% | 10.5% |
| Median | 8.7% | 7.8% |
| Interquartile 25% (IQ1) | 6.7% | 6.6% |
| Interquartile 75% (IQ3) | 10.8% | 12.2% |
| Interquartile Range (IQR) | 4.1% | 5.5% |
| Standard Deviation (Sample) | 4.9% | 7.3% |
| Standard Deviation (Population) | 4.8% | 7.2% |
Similar Demographics by Family Poverty
Demographics Similar to Hawaiians by Family Poverty
In terms of family poverty, the demographic groups most similar to Hawaiians are Immigrants from Cameroon (9.0%, a difference of 0.010%), Immigrants from Syria (9.0%, a difference of 0.030%), Costa Rican (9.0%, a difference of 0.27%), Immigrants from Albania (9.0%, a difference of 0.36%), and Immigrants from Iraq (9.1%, a difference of 0.38%).
| Demographics | Rating | Rank | Family Poverty |
| Kenyans | 58.2 /100 | #170 | Average 8.9% |
| Lebanese | 57.6 /100 | #171 | Average 8.9% |
| Immigrants | Peru | 57.5 /100 | #172 | Average 8.9% |
| Immigrants | Fiji | 56.4 /100 | #173 | Average 8.9% |
| Immigrants | Albania | 50.0 /100 | #174 | Average 9.0% |
| Costa Ricans | 49.3 /100 | #175 | Average 9.0% |
| Immigrants | Syria | 47.5 /100 | #176 | Average 9.0% |
| Hawaiians | 47.2 /100 | #177 | Average 9.0% |
| Immigrants | Cameroon | 47.1 /100 | #178 | Average 9.0% |
| Immigrants | Iraq | 44.4 /100 | #179 | Average 9.1% |
| Immigrants | Uganda | 43.4 /100 | #180 | Average 9.1% |
| Hmong | 40.2 /100 | #181 | Average 9.1% |
| Immigrants | Morocco | 40.2 /100 | #182 | Average 9.1% |
| Uruguayans | 39.2 /100 | #183 | Fair 9.1% |
| South American Indians | 38.7 /100 | #184 | Fair 9.1% |
Demographics Similar to Immigrants from Ukraine by Family Poverty
In terms of family poverty, the demographic groups most similar to Immigrants from Ukraine are Immigrants from Kazakhstan (8.5%, a difference of 0.030%), Immigrants from Nepal (8.5%, a difference of 0.060%), Yugoslavian (8.5%, a difference of 0.11%), Immigrants from Germany (8.5%, a difference of 0.15%), and Albanian (8.5%, a difference of 0.16%).
| Demographics | Rating | Rank | Family Poverty |
| Chileans | 86.6 /100 | #134 | Excellent 8.5% |
| Immigrants | Malaysia | 86.5 /100 | #135 | Excellent 8.5% |
| Immigrants | Brazil | 86.3 /100 | #136 | Excellent 8.5% |
| Immigrants | Southern Europe | 86.0 /100 | #137 | Excellent 8.5% |
| Armenians | 84.6 /100 | #138 | Excellent 8.5% |
| Immigrants | Nepal | 84.2 /100 | #139 | Excellent 8.5% |
| Immigrants | Kazakhstan | 84.1 /100 | #140 | Excellent 8.5% |
| Immigrants | Ukraine | 83.9 /100 | #141 | Excellent 8.5% |
| Yugoslavians | 83.5 /100 | #142 | Excellent 8.5% |
| Immigrants | Germany | 83.3 /100 | #143 | Excellent 8.5% |
| Albanians | 83.3 /100 | #144 | Excellent 8.5% |
| Immigrants | South Eastern Asia | 83.2 /100 | #145 | Excellent 8.5% |
| Immigrants | Belarus | 83.2 /100 | #146 | Excellent 8.5% |
| Immigrants | Jordan | 83.0 /100 | #147 | Excellent 8.5% |
| Scotch-Irish | 82.2 /100 | #148 | Excellent 8.6% |