Hawaiian vs Immigrants from Grenada Family Poverty
COMPARE
Hawaiian
Immigrants from Grenada
Family Poverty
Family Poverty Comparison
Hawaiians
Immigrants from Grenada
9.0%
FAMILY POVERTY
47.2/ 100
METRIC RATING
177th/ 347
METRIC RANK
12.4%
FAMILY POVERTY
0.0/ 100
METRIC RATING
317th/ 347
METRIC RANK
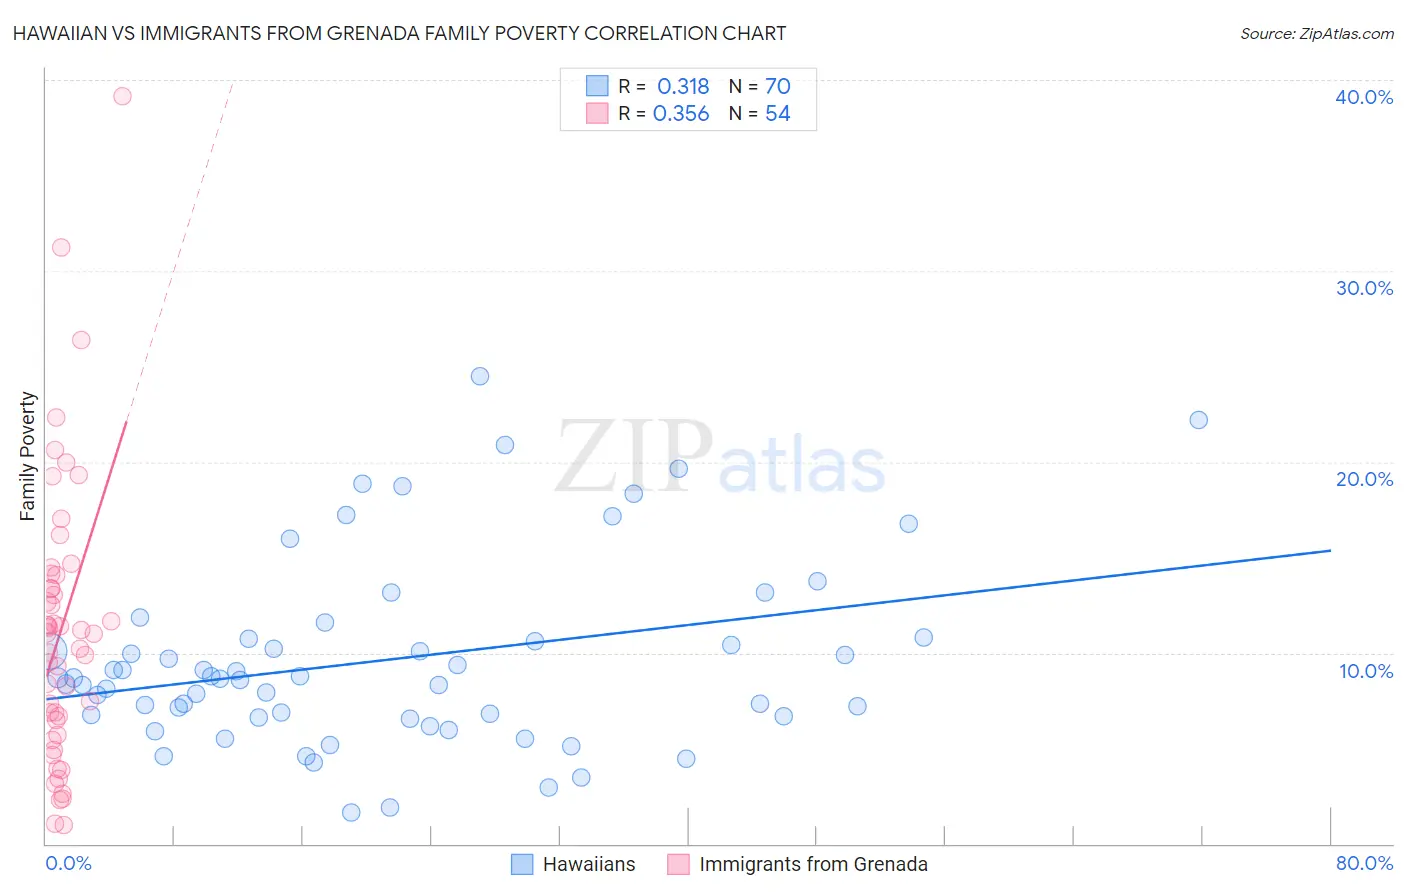
Hawaiian vs Immigrants from Grenada Family Poverty Correlation Chart
The statistical analysis conducted on geographies consisting of 327,007,125 people shows a mild positive correlation between the proportion of Hawaiians and poverty level among families in the United States with a correlation coefficient (R) of 0.318 and weighted average of 9.0%. Similarly, the statistical analysis conducted on geographies consisting of 67,148,285 people shows a mild positive correlation between the proportion of Immigrants from Grenada and poverty level among families in the United States with a correlation coefficient (R) of 0.356 and weighted average of 12.4%, a difference of 37.1%.
Family Poverty Correlation Summary
| Measurement | Hawaiian | Immigrants from Grenada |
| Minimum | 1.6% | 0.96% |
| Maximum | 24.5% | 39.2% |
| Range | 22.9% | 38.2% |
| Mean | 9.6% | 11.3% |
| Median | 8.7% | 11.0% |
| Interquartile 25% (IQ1) | 6.7% | 6.5% |
| Interquartile 75% (IQ3) | 10.8% | 14.1% |
| Interquartile Range (IQR) | 4.1% | 7.6% |
| Standard Deviation (Sample) | 4.9% | 7.4% |
| Standard Deviation (Population) | 4.8% | 7.3% |
Similar Demographics by Family Poverty
Demographics Similar to Hawaiians by Family Poverty
In terms of family poverty, the demographic groups most similar to Hawaiians are Immigrants from Cameroon (9.0%, a difference of 0.010%), Immigrants from Syria (9.0%, a difference of 0.030%), Costa Rican (9.0%, a difference of 0.27%), Immigrants from Albania (9.0%, a difference of 0.36%), and Immigrants from Iraq (9.1%, a difference of 0.38%).
| Demographics | Rating | Rank | Family Poverty |
| Kenyans | 58.2 /100 | #170 | Average 8.9% |
| Lebanese | 57.6 /100 | #171 | Average 8.9% |
| Immigrants | Peru | 57.5 /100 | #172 | Average 8.9% |
| Immigrants | Fiji | 56.4 /100 | #173 | Average 8.9% |
| Immigrants | Albania | 50.0 /100 | #174 | Average 9.0% |
| Costa Ricans | 49.3 /100 | #175 | Average 9.0% |
| Immigrants | Syria | 47.5 /100 | #176 | Average 9.0% |
| Hawaiians | 47.2 /100 | #177 | Average 9.0% |
| Immigrants | Cameroon | 47.1 /100 | #178 | Average 9.0% |
| Immigrants | Iraq | 44.4 /100 | #179 | Average 9.1% |
| Immigrants | Uganda | 43.4 /100 | #180 | Average 9.1% |
| Hmong | 40.2 /100 | #181 | Average 9.1% |
| Immigrants | Morocco | 40.2 /100 | #182 | Average 9.1% |
| Uruguayans | 39.2 /100 | #183 | Fair 9.1% |
| South American Indians | 38.7 /100 | #184 | Fair 9.1% |
Demographics Similar to Immigrants from Grenada by Family Poverty
In terms of family poverty, the demographic groups most similar to Immigrants from Grenada are U.S. Virgin Islander (12.4%, a difference of 0.010%), British West Indian (12.4%, a difference of 0.060%), Honduran (12.4%, a difference of 0.22%), Inupiat (12.5%, a difference of 0.54%), and Immigrants from Mexico (12.3%, a difference of 0.96%).
| Demographics | Rating | Rank | Family Poverty |
| Immigrants | Guatemala | 0.0 /100 | #310 | Tragic 12.0% |
| Ute | 0.0 /100 | #311 | Tragic 12.1% |
| Immigrants | Central America | 0.0 /100 | #312 | Tragic 12.1% |
| Immigrants | Caribbean | 0.0 /100 | #313 | Tragic 12.2% |
| Kiowa | 0.0 /100 | #314 | Tragic 12.2% |
| Immigrants | Mexico | 0.0 /100 | #315 | Tragic 12.3% |
| Hondurans | 0.0 /100 | #316 | Tragic 12.4% |
| Immigrants | Grenada | 0.0 /100 | #317 | Tragic 12.4% |
| U.S. Virgin Islanders | 0.0 /100 | #318 | Tragic 12.4% |
| British West Indians | 0.0 /100 | #319 | Tragic 12.4% |
| Inupiat | 0.0 /100 | #320 | Tragic 12.5% |
| Arapaho | 0.0 /100 | #321 | Tragic 12.7% |
| Immigrants | Honduras | 0.0 /100 | #322 | Tragic 12.7% |
| Menominee | 0.0 /100 | #323 | Tragic 12.7% |
| Immigrants | Dominica | 0.0 /100 | #324 | Tragic 12.7% |