Hawaiian vs Chickasaw Child Poverty Among Girls Under 16
COMPARE
Hawaiian
Chickasaw
Child Poverty Among Girls Under 16
Child Poverty Among Girls Under 16 Comparison
Hawaiians
Chickasaw
16.6%
CHILD POVERTY AMONG GIRLS UNDER 16
43.4/ 100
METRIC RATING
179th/ 347
METRIC RANK
19.6%
CHILD POVERTY AMONG GIRLS UNDER 16
0.1/ 100
METRIC RATING
262nd/ 347
METRIC RANK
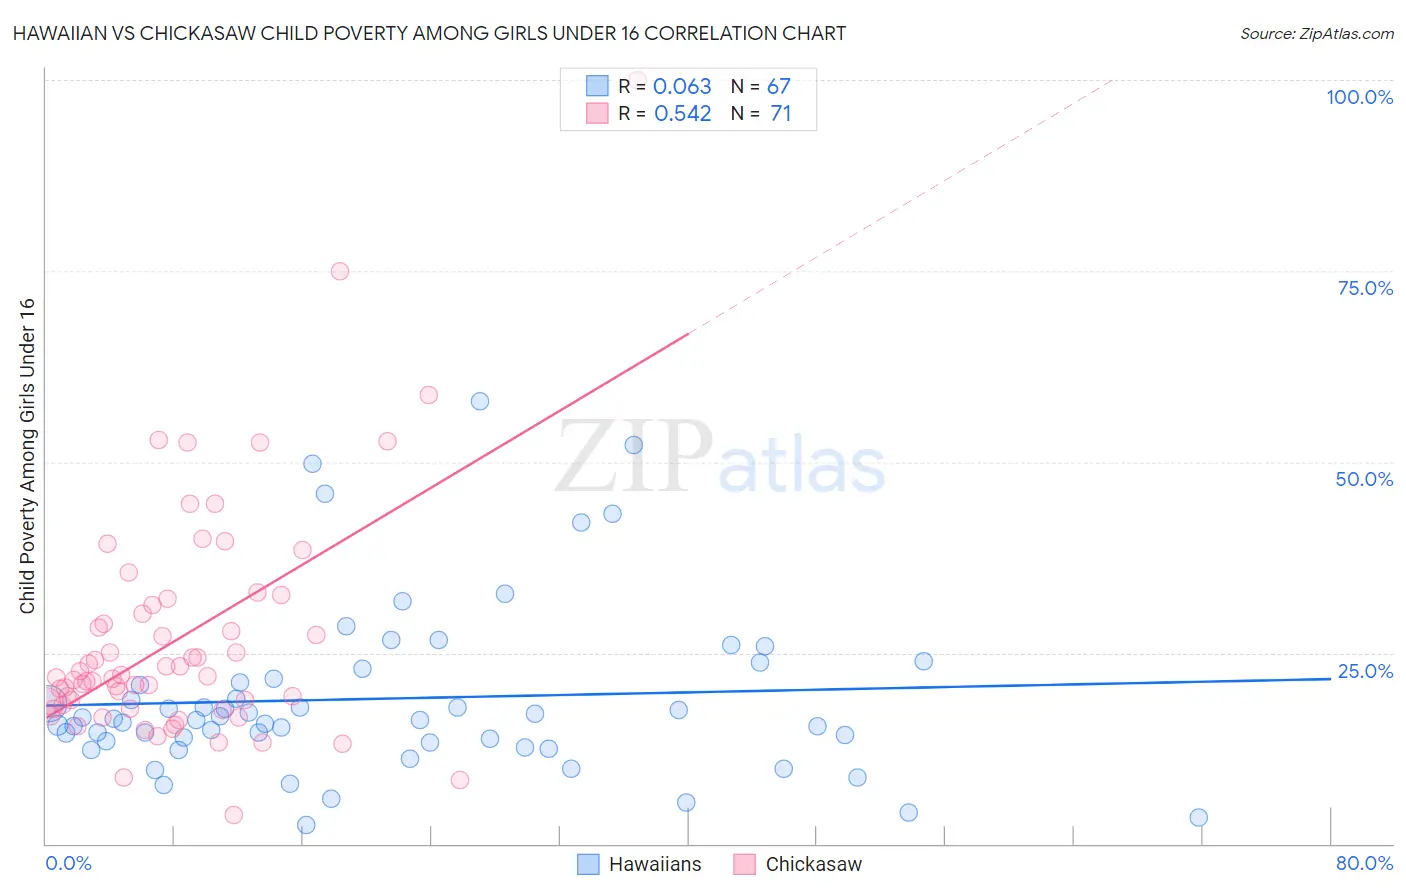
Hawaiian vs Chickasaw Child Poverty Among Girls Under 16 Correlation Chart
The statistical analysis conducted on geographies consisting of 324,247,510 people shows a slight positive correlation between the proportion of Hawaiians and poverty level among girls under the age of 16 in the United States with a correlation coefficient (R) of 0.063 and weighted average of 16.6%. Similarly, the statistical analysis conducted on geographies consisting of 146,952,830 people shows a substantial positive correlation between the proportion of Chickasaw and poverty level among girls under the age of 16 in the United States with a correlation coefficient (R) of 0.542 and weighted average of 19.6%, a difference of 18.3%.
Child Poverty Among Girls Under 16 Correlation Summary
| Measurement | Hawaiian | Chickasaw |
| Minimum | 2.5% | 3.8% |
| Maximum | 57.9% | 100.0% |
| Range | 55.4% | 96.2% |
| Mean | 19.0% | 26.8% |
| Median | 16.1% | 21.7% |
| Interquartile 25% (IQ1) | 13.3% | 17.6% |
| Interquartile 75% (IQ3) | 21.7% | 31.3% |
| Interquartile Range (IQR) | 8.4% | 13.6% |
| Standard Deviation (Sample) | 11.3% | 15.5% |
| Standard Deviation (Population) | 11.2% | 15.4% |
Similar Demographics by Child Poverty Among Girls Under 16
Demographics Similar to Hawaiians by Child Poverty Among Girls Under 16
In terms of child poverty among girls under 16, the demographic groups most similar to Hawaiians are Immigrants from Syria (16.6%, a difference of 0.010%), White/Caucasian (16.6%, a difference of 0.030%), Immigrants from Iraq (16.6%, a difference of 0.030%), Immigrants from Ethiopia (16.6%, a difference of 0.040%), and Immigrants from Western Asia (16.6%, a difference of 0.080%).
| Demographics | Rating | Rank | Child Poverty Among Girls Under 16 |
| Afghans | 62.3 /100 | #172 | Good 16.2% |
| Immigrants | South America | 55.1 /100 | #173 | Average 16.4% |
| Ethiopians | 50.0 /100 | #174 | Average 16.5% |
| Lebanese | 45.4 /100 | #175 | Average 16.6% |
| Hungarians | 45.1 /100 | #176 | Average 16.6% |
| Immigrants | Western Asia | 44.1 /100 | #177 | Average 16.6% |
| Whites/Caucasians | 43.6 /100 | #178 | Average 16.6% |
| Hawaiians | 43.4 /100 | #179 | Average 16.6% |
| Immigrants | Syria | 43.3 /100 | #180 | Average 16.6% |
| Immigrants | Iraq | 43.2 /100 | #181 | Average 16.6% |
| Immigrants | Ethiopia | 43.1 /100 | #182 | Average 16.6% |
| Immigrants | Portugal | 42.5 /100 | #183 | Average 16.6% |
| Scotch-Irish | 39.6 /100 | #184 | Fair 16.7% |
| Immigrants | Uruguay | 35.6 /100 | #185 | Fair 16.7% |
| South American Indians | 35.0 /100 | #186 | Fair 16.8% |
Demographics Similar to Chickasaw by Child Poverty Among Girls Under 16
In terms of child poverty among girls under 16, the demographic groups most similar to Chickasaw are Immigrants from Burma/Myanmar (19.7%, a difference of 0.12%), Jamaican (19.7%, a difference of 0.23%), Vietnamese (19.5%, a difference of 0.52%), Mexican American Indian (19.5%, a difference of 0.61%), and Immigrants from Jamaica (19.8%, a difference of 0.67%).
| Demographics | Rating | Rank | Child Poverty Among Girls Under 16 |
| Immigrants | Ecuador | 0.3 /100 | #255 | Tragic 19.3% |
| Trinidadians and Tobagonians | 0.2 /100 | #256 | Tragic 19.3% |
| Guyanese | 0.2 /100 | #257 | Tragic 19.4% |
| Salvadorans | 0.2 /100 | #258 | Tragic 19.4% |
| Ottawa | 0.2 /100 | #259 | Tragic 19.4% |
| Mexican American Indians | 0.2 /100 | #260 | Tragic 19.5% |
| Vietnamese | 0.2 /100 | #261 | Tragic 19.5% |
| Chickasaw | 0.1 /100 | #262 | Tragic 19.6% |
| Immigrants | Burma/Myanmar | 0.1 /100 | #263 | Tragic 19.7% |
| Jamaicans | 0.1 /100 | #264 | Tragic 19.7% |
| Immigrants | Jamaica | 0.1 /100 | #265 | Tragic 19.8% |
| Spanish Americans | 0.1 /100 | #266 | Tragic 19.8% |
| Immigrants | Bangladesh | 0.1 /100 | #267 | Tragic 19.9% |
| Spanish American Indians | 0.1 /100 | #268 | Tragic 19.9% |
| Liberians | 0.1 /100 | #269 | Tragic 19.9% |