Hawaiian vs Russian Child Poverty Among Girls Under 16
COMPARE
Hawaiian
Russian
Child Poverty Among Girls Under 16
Child Poverty Among Girls Under 16 Comparison
Hawaiians
Russians
16.6%
CHILD POVERTY AMONG GIRLS UNDER 16
43.4/ 100
METRIC RATING
179th/ 347
METRIC RANK
13.9%
CHILD POVERTY AMONG GIRLS UNDER 16
99.6/ 100
METRIC RATING
36th/ 347
METRIC RANK
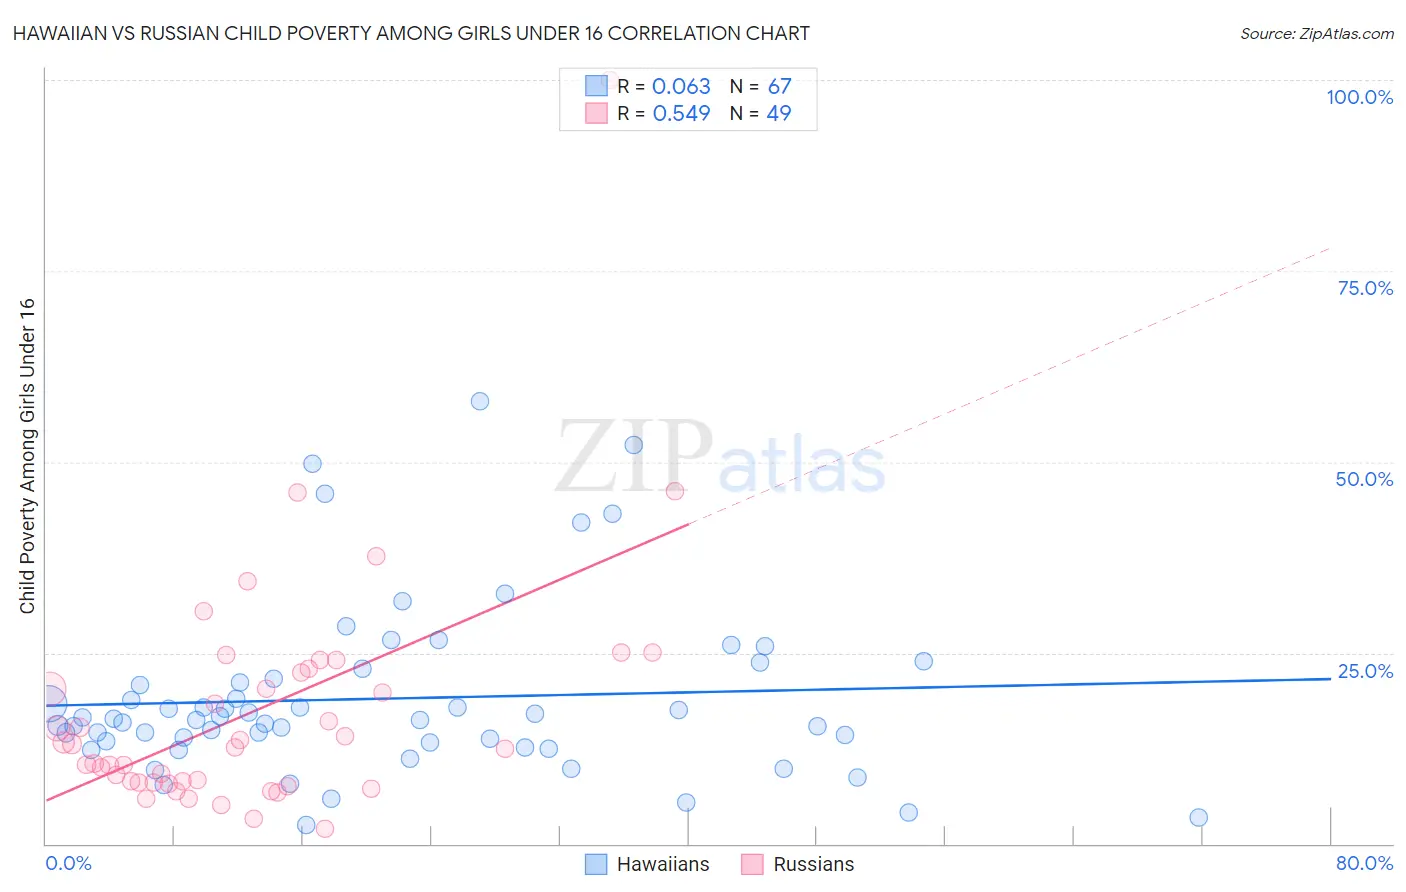
Hawaiian vs Russian Child Poverty Among Girls Under 16 Correlation Chart
The statistical analysis conducted on geographies consisting of 324,247,510 people shows a slight positive correlation between the proportion of Hawaiians and poverty level among girls under the age of 16 in the United States with a correlation coefficient (R) of 0.063 and weighted average of 16.6%. Similarly, the statistical analysis conducted on geographies consisting of 495,383,256 people shows a substantial positive correlation between the proportion of Russians and poverty level among girls under the age of 16 in the United States with a correlation coefficient (R) of 0.549 and weighted average of 13.9%, a difference of 19.7%.
Child Poverty Among Girls Under 16 Correlation Summary
| Measurement | Hawaiian | Russian |
| Minimum | 2.5% | 1.9% |
| Maximum | 57.9% | 100.0% |
| Range | 55.4% | 98.1% |
| Mean | 19.0% | 17.2% |
| Median | 16.1% | 12.5% |
| Interquartile 25% (IQ1) | 13.3% | 8.0% |
| Interquartile 75% (IQ3) | 21.7% | 22.6% |
| Interquartile Range (IQR) | 8.4% | 14.6% |
| Standard Deviation (Sample) | 11.3% | 15.9% |
| Standard Deviation (Population) | 11.2% | 15.7% |
Similar Demographics by Child Poverty Among Girls Under 16
Demographics Similar to Hawaiians by Child Poverty Among Girls Under 16
In terms of child poverty among girls under 16, the demographic groups most similar to Hawaiians are Immigrants from Syria (16.6%, a difference of 0.010%), White/Caucasian (16.6%, a difference of 0.030%), Immigrants from Iraq (16.6%, a difference of 0.030%), Immigrants from Ethiopia (16.6%, a difference of 0.040%), and Immigrants from Western Asia (16.6%, a difference of 0.080%).
| Demographics | Rating | Rank | Child Poverty Among Girls Under 16 |
| Afghans | 62.3 /100 | #172 | Good 16.2% |
| Immigrants | South America | 55.1 /100 | #173 | Average 16.4% |
| Ethiopians | 50.0 /100 | #174 | Average 16.5% |
| Lebanese | 45.4 /100 | #175 | Average 16.6% |
| Hungarians | 45.1 /100 | #176 | Average 16.6% |
| Immigrants | Western Asia | 44.1 /100 | #177 | Average 16.6% |
| Whites/Caucasians | 43.6 /100 | #178 | Average 16.6% |
| Hawaiians | 43.4 /100 | #179 | Average 16.6% |
| Immigrants | Syria | 43.3 /100 | #180 | Average 16.6% |
| Immigrants | Iraq | 43.2 /100 | #181 | Average 16.6% |
| Immigrants | Ethiopia | 43.1 /100 | #182 | Average 16.6% |
| Immigrants | Portugal | 42.5 /100 | #183 | Average 16.6% |
| Scotch-Irish | 39.6 /100 | #184 | Fair 16.7% |
| Immigrants | Uruguay | 35.6 /100 | #185 | Fair 16.7% |
| South American Indians | 35.0 /100 | #186 | Fair 16.8% |
Demographics Similar to Russians by Child Poverty Among Girls Under 16
In terms of child poverty among girls under 16, the demographic groups most similar to Russians are Lithuanian (13.9%, a difference of 0.020%), Immigrants from Northern Europe (13.8%, a difference of 0.15%), Immigrants from Moldova (13.9%, a difference of 0.32%), Immigrants from Australia (14.0%, a difference of 0.97%), and Immigrants from Sri Lanka (14.0%, a difference of 1.1%).
| Demographics | Rating | Rank | Child Poverty Among Girls Under 16 |
| Bolivians | 99.8 /100 | #29 | Exceptional 13.6% |
| Asians | 99.7 /100 | #30 | Exceptional 13.7% |
| Turks | 99.7 /100 | #31 | Exceptional 13.7% |
| Danes | 99.7 /100 | #32 | Exceptional 13.7% |
| Swedes | 99.7 /100 | #33 | Exceptional 13.7% |
| Maltese | 99.7 /100 | #34 | Exceptional 13.7% |
| Immigrants | Northern Europe | 99.6 /100 | #35 | Exceptional 13.8% |
| Russians | 99.6 /100 | #36 | Exceptional 13.9% |
| Lithuanians | 99.6 /100 | #37 | Exceptional 13.9% |
| Immigrants | Moldova | 99.6 /100 | #38 | Exceptional 13.9% |
| Immigrants | Australia | 99.5 /100 | #39 | Exceptional 14.0% |
| Immigrants | Sri Lanka | 99.5 /100 | #40 | Exceptional 14.0% |
| Immigrants | Bolivia | 99.5 /100 | #41 | Exceptional 14.0% |
| Immigrants | Scotland | 99.4 /100 | #42 | Exceptional 14.0% |
| Koreans | 99.4 /100 | #43 | Exceptional 14.1% |