Guyanese vs Inupiat Receiving Food Stamps
COMPARE
Guyanese
Inupiat
Receiving Food Stamps
Receiving Food Stamps Comparison
Guyanese
Inupiat
16.7%
RECEIVING FOOD STAMPS
0.0/ 100
METRIC RATING
311th/ 347
METRIC RANK
20.1%
RECEIVING FOOD STAMPS
0.0/ 100
METRIC RATING
333rd/ 347
METRIC RANK
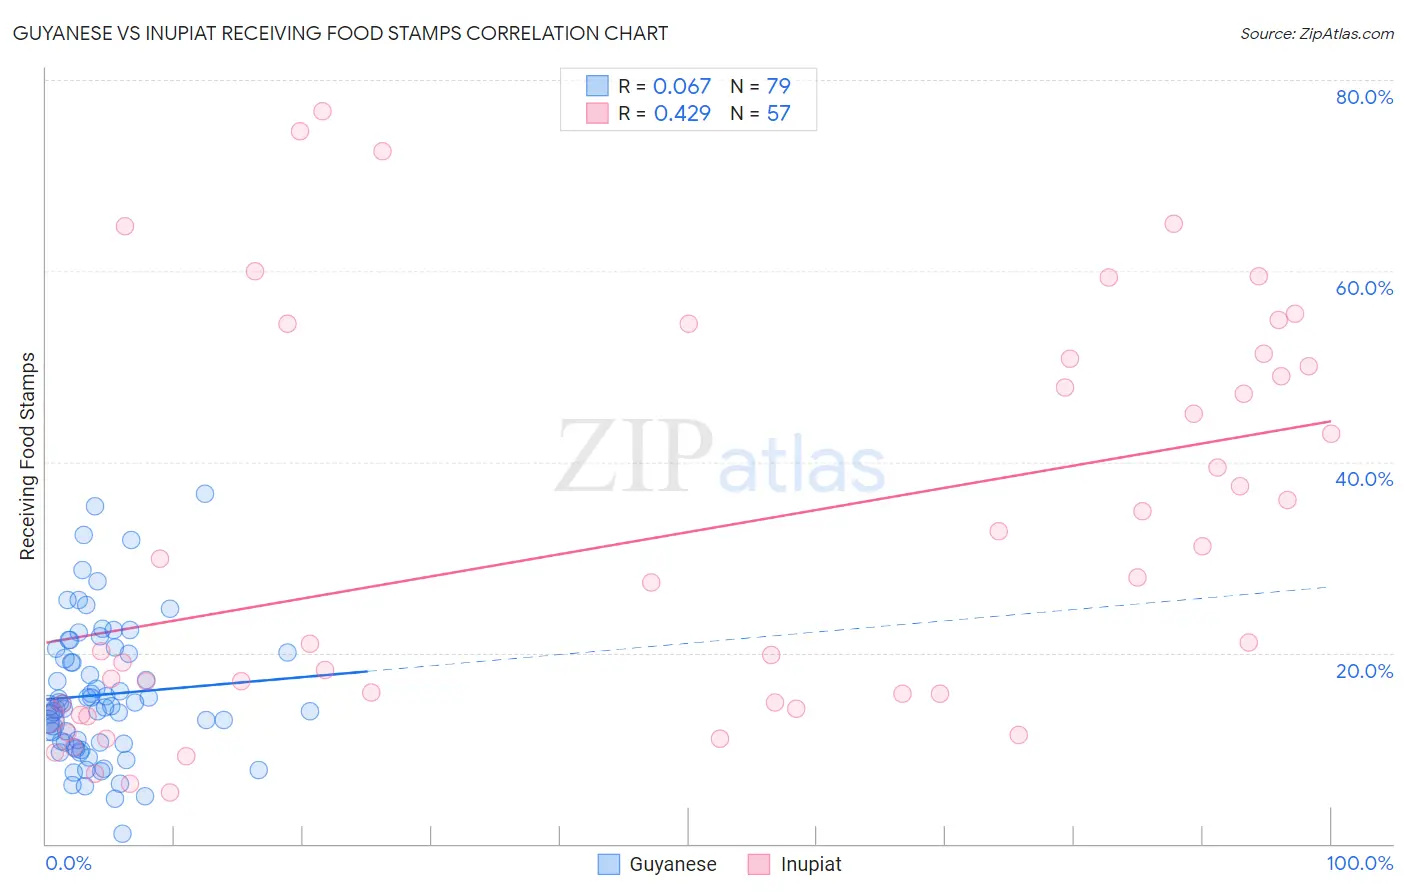
Guyanese vs Inupiat Receiving Food Stamps Correlation Chart
The statistical analysis conducted on geographies consisting of 176,625,032 people shows a slight positive correlation between the proportion of Guyanese and percentage of population receiving government assistance and/or food stamps in the United States with a correlation coefficient (R) of 0.067 and weighted average of 16.7%. Similarly, the statistical analysis conducted on geographies consisting of 96,290,078 people shows a moderate positive correlation between the proportion of Inupiat and percentage of population receiving government assistance and/or food stamps in the United States with a correlation coefficient (R) of 0.429 and weighted average of 20.1%, a difference of 20.0%.
Receiving Food Stamps Correlation Summary
| Measurement | Guyanese | Inupiat |
| Minimum | 1.0% | 5.4% |
| Maximum | 36.6% | 76.7% |
| Range | 35.6% | 71.3% |
| Mean | 15.6% | 32.0% |
| Median | 14.4% | 27.3% |
| Interquartile 25% (IQ1) | 10.6% | 14.4% |
| Interquartile 75% (IQ3) | 20.0% | 50.4% |
| Interquartile Range (IQR) | 9.4% | 36.0% |
| Standard Deviation (Sample) | 7.1% | 20.6% |
| Standard Deviation (Population) | 7.1% | 20.4% |
Similar Demographics by Receiving Food Stamps
Demographics Similar to Guyanese by Receiving Food Stamps
In terms of receiving food stamps, the demographic groups most similar to Guyanese are Immigrants from Barbados (16.6%, a difference of 0.52%), Sioux (16.8%, a difference of 0.70%), Immigrants from Jamaica (16.9%, a difference of 0.98%), U.S. Virgin Islander (16.5%, a difference of 1.1%), and Immigrants from Guyana (16.9%, a difference of 1.2%).
| Demographics | Rating | Rank | Receiving Food Stamps |
| West Indians | 0.0 /100 | #304 | Tragic 16.3% |
| Immigrants | Azores | 0.0 /100 | #305 | Tragic 16.4% |
| Jamaicans | 0.0 /100 | #306 | Tragic 16.4% |
| Houma | 0.0 /100 | #307 | Tragic 16.5% |
| Barbadians | 0.0 /100 | #308 | Tragic 16.5% |
| U.S. Virgin Islanders | 0.0 /100 | #309 | Tragic 16.5% |
| Immigrants | Barbados | 0.0 /100 | #310 | Tragic 16.6% |
| Guyanese | 0.0 /100 | #311 | Tragic 16.7% |
| Sioux | 0.0 /100 | #312 | Tragic 16.8% |
| Immigrants | Jamaica | 0.0 /100 | #313 | Tragic 16.9% |
| Immigrants | Guyana | 0.0 /100 | #314 | Tragic 16.9% |
| Bahamians | 0.0 /100 | #315 | Tragic 17.0% |
| Central American Indians | 0.0 /100 | #316 | Tragic 17.1% |
| Blacks/African Americans | 0.0 /100 | #317 | Tragic 17.2% |
| Menominee | 0.0 /100 | #318 | Tragic 17.2% |
Demographics Similar to Inupiat by Receiving Food Stamps
In terms of receiving food stamps, the demographic groups most similar to Inupiat are Pueblo (19.9%, a difference of 0.73%), Yuman (20.2%, a difference of 0.86%), Immigrants from Caribbean (19.6%, a difference of 2.2%), Immigrants from Cuba (20.8%, a difference of 3.8%), and Navajo (21.1%, a difference of 5.0%).
| Demographics | Rating | Rank | Receiving Food Stamps |
| Cubans | 0.0 /100 | #326 | Tragic 18.2% |
| Apache | 0.0 /100 | #327 | Tragic 18.3% |
| Colville | 0.0 /100 | #328 | Tragic 18.3% |
| Immigrants | Dominica | 0.0 /100 | #329 | Tragic 18.4% |
| Pima | 0.0 /100 | #330 | Tragic 19.0% |
| Immigrants | Caribbean | 0.0 /100 | #331 | Tragic 19.6% |
| Pueblo | 0.0 /100 | #332 | Tragic 19.9% |
| Inupiat | 0.0 /100 | #333 | Tragic 20.1% |
| Yuman | 0.0 /100 | #334 | Tragic 20.2% |
| Immigrants | Cuba | 0.0 /100 | #335 | Tragic 20.8% |
| Navajo | 0.0 /100 | #336 | Tragic 21.1% |
| Cape Verdeans | 0.0 /100 | #337 | Tragic 21.1% |
| Dominicans | 0.0 /100 | #338 | Tragic 21.4% |
| Yakama | 0.0 /100 | #339 | Tragic 21.4% |
| Tohono O'odham | 0.0 /100 | #340 | Tragic 21.5% |