Guyanese vs Albanian Receiving Food Stamps
COMPARE
Guyanese
Albanian
Receiving Food Stamps
Receiving Food Stamps Comparison
Guyanese
Albanians
16.7%
RECEIVING FOOD STAMPS
0.0/ 100
METRIC RATING
311th/ 347
METRIC RANK
12.0%
RECEIVING FOOD STAMPS
35.4/ 100
METRIC RATING
187th/ 347
METRIC RANK
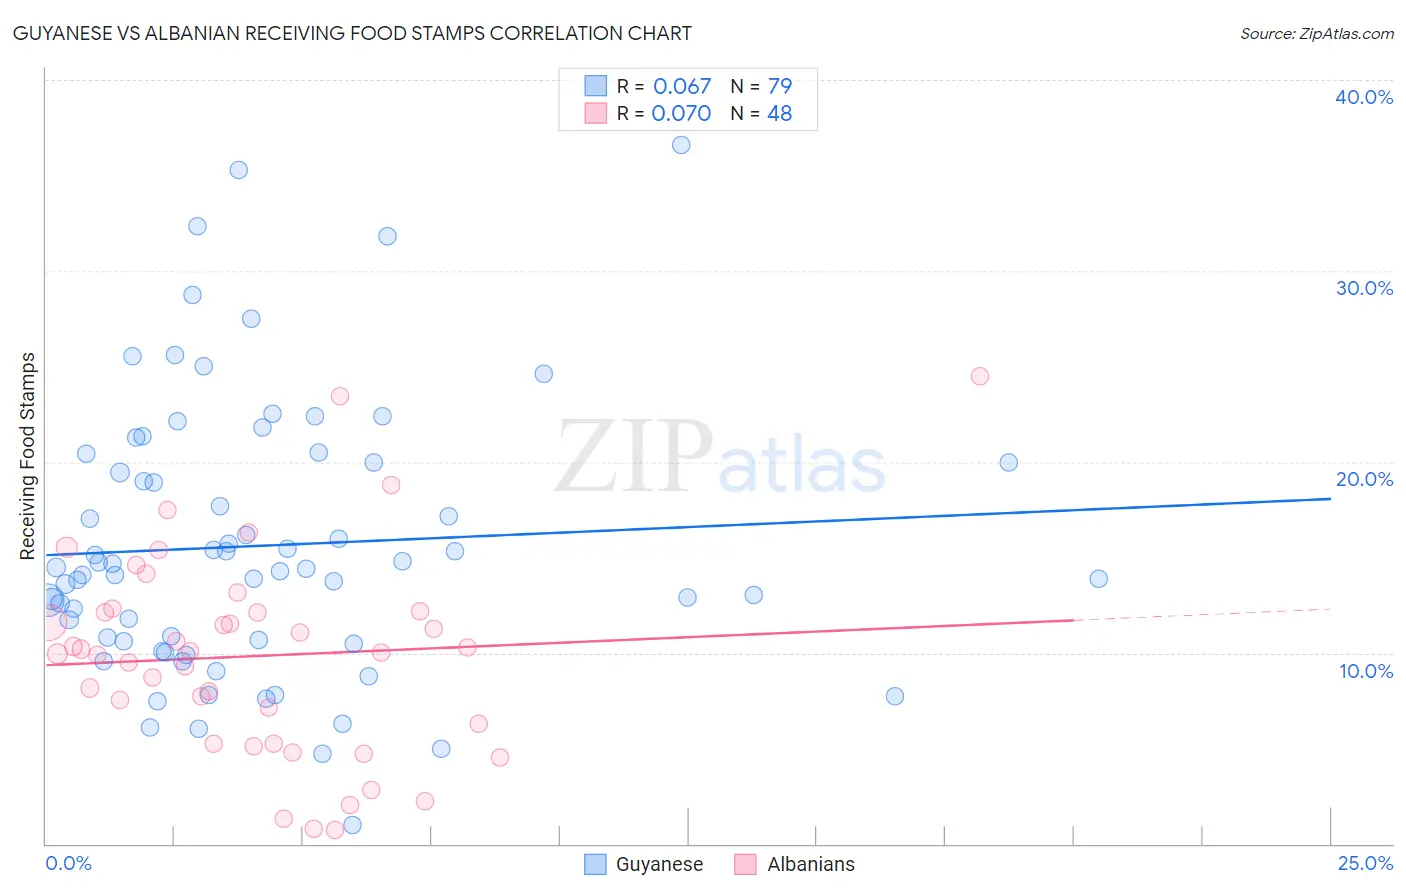
Guyanese vs Albanian Receiving Food Stamps Correlation Chart
The statistical analysis conducted on geographies consisting of 176,625,032 people shows a slight positive correlation between the proportion of Guyanese and percentage of population receiving government assistance and/or food stamps in the United States with a correlation coefficient (R) of 0.067 and weighted average of 16.7%. Similarly, the statistical analysis conducted on geographies consisting of 192,875,347 people shows a slight positive correlation between the proportion of Albanians and percentage of population receiving government assistance and/or food stamps in the United States with a correlation coefficient (R) of 0.070 and weighted average of 12.0%, a difference of 39.5%.
Receiving Food Stamps Correlation Summary
| Measurement | Guyanese | Albanian |
| Minimum | 1.0% | 0.70% |
| Maximum | 36.6% | 24.5% |
| Range | 35.6% | 23.8% |
| Mean | 15.6% | 9.8% |
| Median | 14.4% | 10.0% |
| Interquartile 25% (IQ1) | 10.6% | 5.8% |
| Interquartile 75% (IQ3) | 20.0% | 12.2% |
| Interquartile Range (IQR) | 9.4% | 6.4% |
| Standard Deviation (Sample) | 7.1% | 5.3% |
| Standard Deviation (Population) | 7.1% | 5.2% |
Similar Demographics by Receiving Food Stamps
Demographics Similar to Guyanese by Receiving Food Stamps
In terms of receiving food stamps, the demographic groups most similar to Guyanese are Immigrants from Barbados (16.6%, a difference of 0.52%), Sioux (16.8%, a difference of 0.70%), Immigrants from Jamaica (16.9%, a difference of 0.98%), U.S. Virgin Islander (16.5%, a difference of 1.1%), and Immigrants from Guyana (16.9%, a difference of 1.2%).
| Demographics | Rating | Rank | Receiving Food Stamps |
| West Indians | 0.0 /100 | #304 | Tragic 16.3% |
| Immigrants | Azores | 0.0 /100 | #305 | Tragic 16.4% |
| Jamaicans | 0.0 /100 | #306 | Tragic 16.4% |
| Houma | 0.0 /100 | #307 | Tragic 16.5% |
| Barbadians | 0.0 /100 | #308 | Tragic 16.5% |
| U.S. Virgin Islanders | 0.0 /100 | #309 | Tragic 16.5% |
| Immigrants | Barbados | 0.0 /100 | #310 | Tragic 16.6% |
| Guyanese | 0.0 /100 | #311 | Tragic 16.7% |
| Sioux | 0.0 /100 | #312 | Tragic 16.8% |
| Immigrants | Jamaica | 0.0 /100 | #313 | Tragic 16.9% |
| Immigrants | Guyana | 0.0 /100 | #314 | Tragic 16.9% |
| Bahamians | 0.0 /100 | #315 | Tragic 17.0% |
| Central American Indians | 0.0 /100 | #316 | Tragic 17.1% |
| Blacks/African Americans | 0.0 /100 | #317 | Tragic 17.2% |
| Menominee | 0.0 /100 | #318 | Tragic 17.2% |
Demographics Similar to Albanians by Receiving Food Stamps
In terms of receiving food stamps, the demographic groups most similar to Albanians are Spanish (12.0%, a difference of 0.22%), Immigrants from Iraq (12.0%, a difference of 0.25%), Sudanese (12.0%, a difference of 0.31%), Immigrants from Cameroon (12.0%, a difference of 0.44%), and Immigrants from Peru (12.0%, a difference of 0.50%).
| Demographics | Rating | Rank | Receiving Food Stamps |
| Uruguayans | 44.8 /100 | #180 | Average 11.8% |
| South American Indians | 41.7 /100 | #181 | Average 11.9% |
| Immigrants | Morocco | 40.7 /100 | #182 | Average 11.9% |
| Immigrants | Uganda | 40.3 /100 | #183 | Average 11.9% |
| Spaniards | 39.8 /100 | #184 | Fair 11.9% |
| Immigrants | Iraq | 37.1 /100 | #185 | Fair 12.0% |
| Spanish | 36.9 /100 | #186 | Fair 12.0% |
| Albanians | 35.4 /100 | #187 | Fair 12.0% |
| Sudanese | 33.4 /100 | #188 | Fair 12.0% |
| Immigrants | Cameroon | 32.5 /100 | #189 | Fair 12.0% |
| Immigrants | Peru | 32.2 /100 | #190 | Fair 12.0% |
| Venezuelans | 32.1 /100 | #191 | Fair 12.0% |
| Samoans | 31.0 /100 | #192 | Fair 12.1% |
| Immigrants | Fiji | 27.8 /100 | #193 | Fair 12.1% |
| Immigrants | Sudan | 27.1 /100 | #194 | Fair 12.1% |