Guyanese vs Tohono O'odham Ambulatory Disability
COMPARE
Guyanese
Tohono O'odham
Ambulatory Disability
Ambulatory Disability Comparison
Guyanese
Tohono O'odham
6.6%
AMBULATORY DISABILITY
0.2/ 100
METRIC RATING
266th/ 347
METRIC RANK
8.7%
AMBULATORY DISABILITY
0.0/ 100
METRIC RATING
343rd/ 347
METRIC RANK
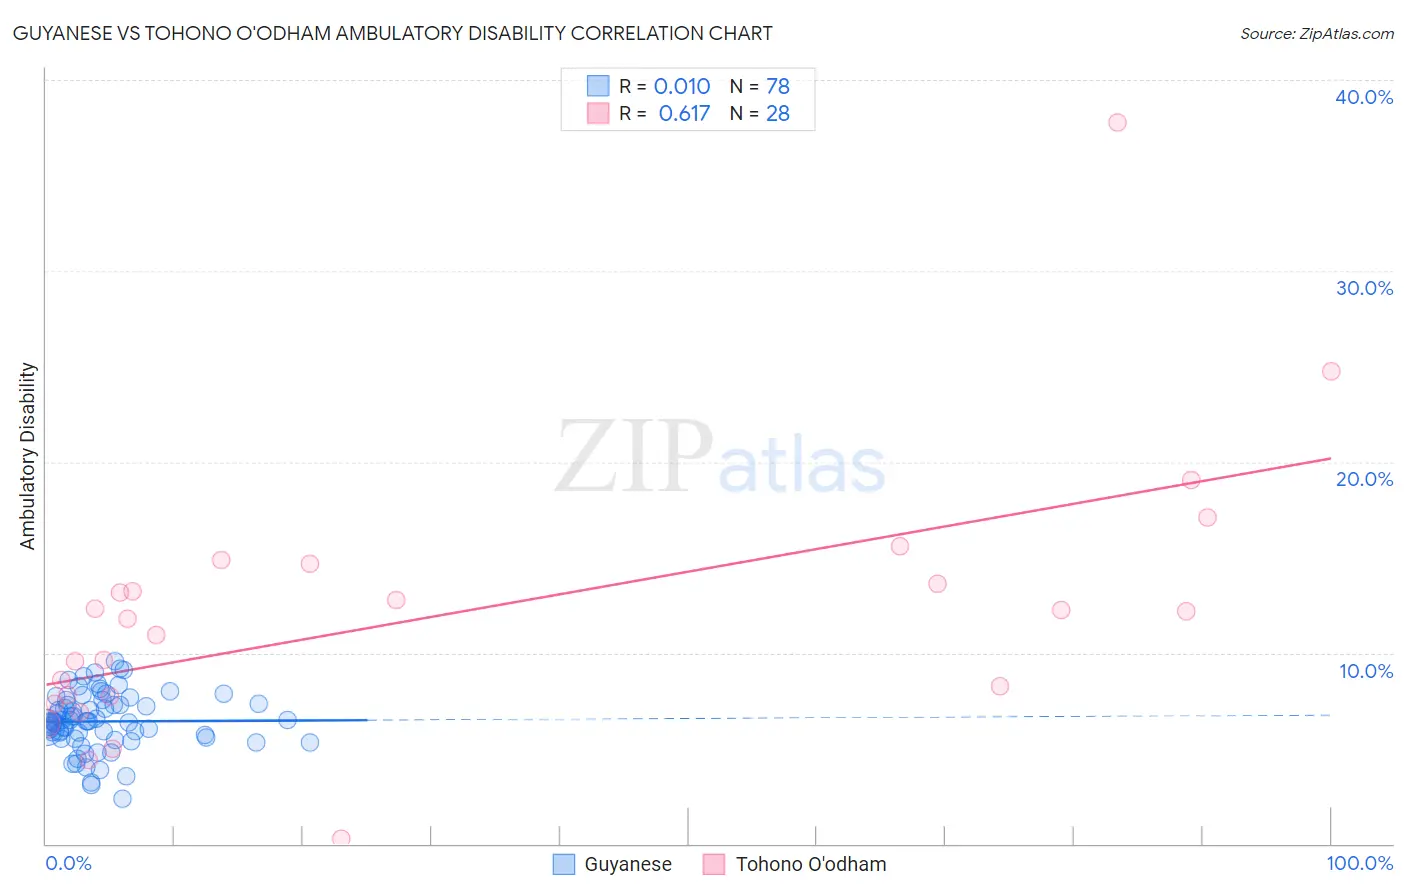
Guyanese vs Tohono O'odham Ambulatory Disability Correlation Chart
The statistical analysis conducted on geographies consisting of 176,872,924 people shows no correlation between the proportion of Guyanese and percentage of population with ambulatory disability in the United States with a correlation coefficient (R) of 0.010 and weighted average of 6.6%. Similarly, the statistical analysis conducted on geographies consisting of 58,714,537 people shows a significant positive correlation between the proportion of Tohono O'odham and percentage of population with ambulatory disability in the United States with a correlation coefficient (R) of 0.617 and weighted average of 8.7%, a difference of 32.0%.
Ambulatory Disability Correlation Summary
| Measurement | Guyanese | Tohono O'odham |
| Minimum | 2.4% | 0.26% |
| Maximum | 9.5% | 37.8% |
| Range | 7.2% | 37.5% |
| Mean | 6.4% | 12.1% |
| Median | 6.4% | 12.0% |
| Interquartile 25% (IQ1) | 5.6% | 7.8% |
| Interquartile 75% (IQ3) | 7.4% | 14.2% |
| Interquartile Range (IQR) | 1.8% | 6.4% |
| Standard Deviation (Sample) | 1.5% | 7.0% |
| Standard Deviation (Population) | 1.5% | 6.9% |
Similar Demographics by Ambulatory Disability
Demographics Similar to Guyanese by Ambulatory Disability
In terms of ambulatory disability, the demographic groups most similar to Guyanese are Bahamian (6.6%, a difference of 0.12%), Trinidadian and Tobagonian (6.6%, a difference of 0.13%), Spanish (6.6%, a difference of 0.14%), Nepalese (6.6%, a difference of 0.18%), and French (6.6%, a difference of 0.45%).
| Demographics | Rating | Rank | Ambulatory Disability |
| Aleuts | 0.4 /100 | #259 | Tragic 6.6% |
| Immigrants | Belize | 0.4 /100 | #260 | Tragic 6.6% |
| Irish | 0.4 /100 | #261 | Tragic 6.6% |
| English | 0.4 /100 | #262 | Tragic 6.6% |
| Hmong | 0.3 /100 | #263 | Tragic 6.6% |
| Nepalese | 0.2 /100 | #264 | Tragic 6.6% |
| Bahamians | 0.2 /100 | #265 | Tragic 6.6% |
| Guyanese | 0.2 /100 | #266 | Tragic 6.6% |
| Trinidadians and Tobagonians | 0.2 /100 | #267 | Tragic 6.6% |
| Spanish | 0.2 /100 | #268 | Tragic 6.6% |
| French | 0.1 /100 | #269 | Tragic 6.6% |
| Slovaks | 0.1 /100 | #270 | Tragic 6.7% |
| Immigrants | Trinidad and Tobago | 0.1 /100 | #271 | Tragic 6.7% |
| French Canadians | 0.1 /100 | #272 | Tragic 6.7% |
| Whites/Caucasians | 0.1 /100 | #273 | Tragic 6.7% |
Demographics Similar to Tohono O'odham by Ambulatory Disability
In terms of ambulatory disability, the demographic groups most similar to Tohono O'odham are Tsimshian (8.8%, a difference of 0.97%), Kiowa (8.6%, a difference of 1.5%), Puerto Rican (8.9%, a difference of 1.6%), Creek (8.5%, a difference of 3.4%), and Choctaw (8.3%, a difference of 5.1%).
| Demographics | Rating | Rank | Ambulatory Disability |
| Cherokee | 0.0 /100 | #333 | Tragic 7.9% |
| Yuman | 0.0 /100 | #334 | Tragic 7.9% |
| Chickasaw | 0.0 /100 | #335 | Tragic 8.0% |
| Seminole | 0.0 /100 | #336 | Tragic 8.0% |
| Dutch West Indians | 0.0 /100 | #337 | Tragic 8.2% |
| Colville | 0.0 /100 | #338 | Tragic 8.2% |
| Pima | 0.0 /100 | #339 | Tragic 8.2% |
| Choctaw | 0.0 /100 | #340 | Tragic 8.3% |
| Creek | 0.0 /100 | #341 | Tragic 8.5% |
| Kiowa | 0.0 /100 | #342 | Tragic 8.6% |
| Tohono O'odham | 0.0 /100 | #343 | Tragic 8.7% |
| Tsimshian | 0.0 /100 | #344 | Tragic 8.8% |
| Puerto Ricans | 0.0 /100 | #345 | Tragic 8.9% |
| Houma | 0.0 /100 | #346 | Tragic 9.3% |
| Lumbee | 0.0 /100 | #347 | Tragic 9.5% |