Guyanese vs Immigrants from Panama Receiving Food Stamps
COMPARE
Guyanese
Immigrants from Panama
Receiving Food Stamps
Receiving Food Stamps Comparison
Guyanese
Immigrants from Panama
16.7%
RECEIVING FOOD STAMPS
0.0/ 100
METRIC RATING
311th/ 347
METRIC RANK
13.6%
RECEIVING FOOD STAMPS
1.0/ 100
METRIC RATING
242nd/ 347
METRIC RANK
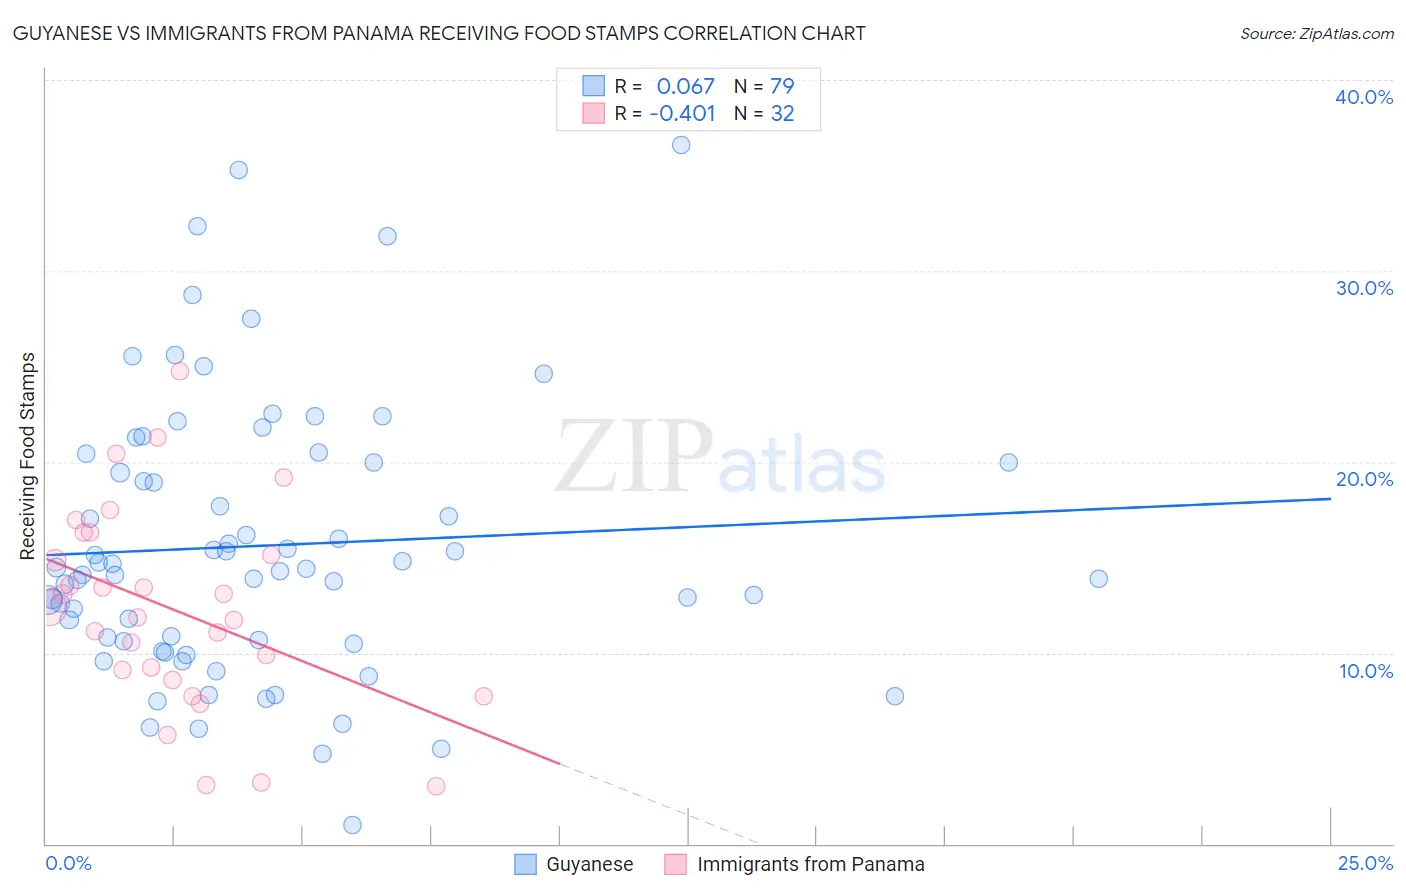
Guyanese vs Immigrants from Panama Receiving Food Stamps Correlation Chart
The statistical analysis conducted on geographies consisting of 176,625,032 people shows a slight positive correlation between the proportion of Guyanese and percentage of population receiving government assistance and/or food stamps in the United States with a correlation coefficient (R) of 0.067 and weighted average of 16.7%. Similarly, the statistical analysis conducted on geographies consisting of 221,020,717 people shows a moderate negative correlation between the proportion of Immigrants from Panama and percentage of population receiving government assistance and/or food stamps in the United States with a correlation coefficient (R) of -0.401 and weighted average of 13.6%, a difference of 22.6%.
Receiving Food Stamps Correlation Summary
| Measurement | Guyanese | Immigrants from Panama |
| Minimum | 1.0% | 3.0% |
| Maximum | 36.6% | 24.8% |
| Range | 35.6% | 21.8% |
| Mean | 15.6% | 12.3% |
| Median | 14.4% | 12.1% |
| Interquartile 25% (IQ1) | 10.6% | 8.8% |
| Interquartile 75% (IQ3) | 20.0% | 15.7% |
| Interquartile Range (IQR) | 9.4% | 6.8% |
| Standard Deviation (Sample) | 7.1% | 5.3% |
| Standard Deviation (Population) | 7.1% | 5.2% |
Similar Demographics by Receiving Food Stamps
Demographics Similar to Guyanese by Receiving Food Stamps
In terms of receiving food stamps, the demographic groups most similar to Guyanese are Immigrants from Barbados (16.6%, a difference of 0.52%), Sioux (16.8%, a difference of 0.70%), Immigrants from Jamaica (16.9%, a difference of 0.98%), U.S. Virgin Islander (16.5%, a difference of 1.1%), and Immigrants from Guyana (16.9%, a difference of 1.2%).
| Demographics | Rating | Rank | Receiving Food Stamps |
| West Indians | 0.0 /100 | #304 | Tragic 16.3% |
| Immigrants | Azores | 0.0 /100 | #305 | Tragic 16.4% |
| Jamaicans | 0.0 /100 | #306 | Tragic 16.4% |
| Houma | 0.0 /100 | #307 | Tragic 16.5% |
| Barbadians | 0.0 /100 | #308 | Tragic 16.5% |
| U.S. Virgin Islanders | 0.0 /100 | #309 | Tragic 16.5% |
| Immigrants | Barbados | 0.0 /100 | #310 | Tragic 16.6% |
| Guyanese | 0.0 /100 | #311 | Tragic 16.7% |
| Sioux | 0.0 /100 | #312 | Tragic 16.8% |
| Immigrants | Jamaica | 0.0 /100 | #313 | Tragic 16.9% |
| Immigrants | Guyana | 0.0 /100 | #314 | Tragic 16.9% |
| Bahamians | 0.0 /100 | #315 | Tragic 17.0% |
| Central American Indians | 0.0 /100 | #316 | Tragic 17.1% |
| Blacks/African Americans | 0.0 /100 | #317 | Tragic 17.2% |
| Menominee | 0.0 /100 | #318 | Tragic 17.2% |
Demographics Similar to Immigrants from Panama by Receiving Food Stamps
In terms of receiving food stamps, the demographic groups most similar to Immigrants from Panama are Choctaw (13.6%, a difference of 0.18%), Somali (13.7%, a difference of 0.19%), Cajun (13.7%, a difference of 0.35%), Immigrants from Somalia (13.7%, a difference of 0.39%), and Iroquois (13.5%, a difference of 0.62%).
| Demographics | Rating | Rank | Receiving Food Stamps |
| Immigrants | Zaire | 1.9 /100 | #235 | Tragic 13.4% |
| Crow | 1.6 /100 | #236 | Tragic 13.4% |
| Immigrants | El Salvador | 1.5 /100 | #237 | Tragic 13.5% |
| French American Indians | 1.4 /100 | #238 | Tragic 13.5% |
| Immigrants | Micronesia | 1.3 /100 | #239 | Tragic 13.5% |
| Iroquois | 1.2 /100 | #240 | Tragic 13.5% |
| Choctaw | 1.0 /100 | #241 | Tragic 13.6% |
| Immigrants | Panama | 1.0 /100 | #242 | Tragic 13.6% |
| Somalis | 0.9 /100 | #243 | Tragic 13.7% |
| Cajuns | 0.9 /100 | #244 | Tragic 13.7% |
| Immigrants | Somalia | 0.9 /100 | #245 | Tragic 13.7% |
| Cree | 0.8 /100 | #246 | Tragic 13.7% |
| Mexican American Indians | 0.7 /100 | #247 | Tragic 13.8% |
| Immigrants | Laos | 0.7 /100 | #248 | Tragic 13.8% |
| Indonesians | 0.6 /100 | #249 | Tragic 13.9% |