Guyanese vs Icelander Receiving Food Stamps
COMPARE
Guyanese
Icelander
Receiving Food Stamps
Receiving Food Stamps Comparison
Guyanese
Icelanders
16.7%
RECEIVING FOOD STAMPS
0.0/ 100
METRIC RATING
311th/ 347
METRIC RANK
10.5%
RECEIVING FOOD STAMPS
95.4/ 100
METRIC RATING
113th/ 347
METRIC RANK
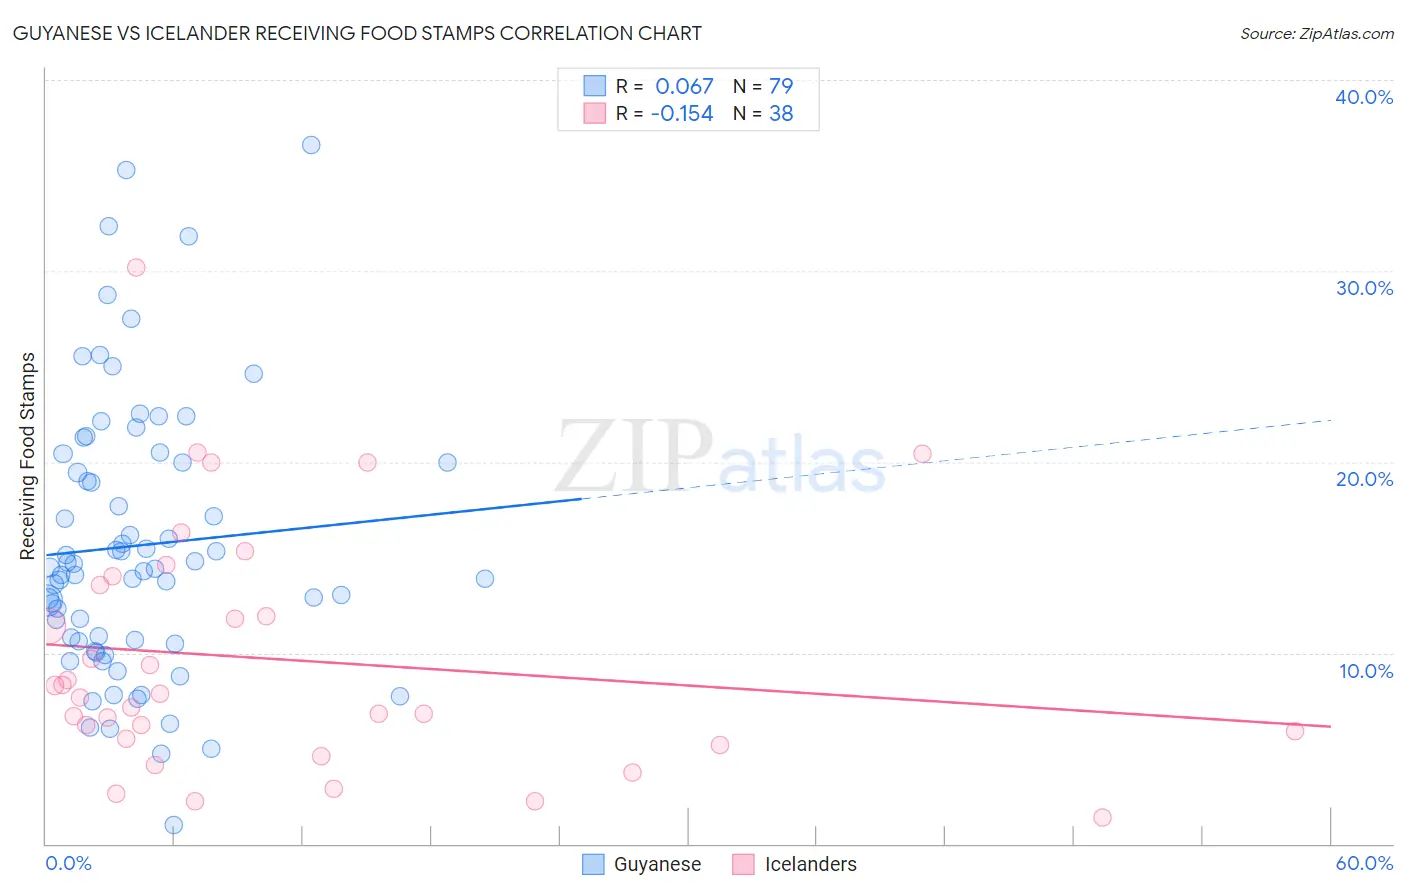
Guyanese vs Icelander Receiving Food Stamps Correlation Chart
The statistical analysis conducted on geographies consisting of 176,625,032 people shows a slight positive correlation between the proportion of Guyanese and percentage of population receiving government assistance and/or food stamps in the United States with a correlation coefficient (R) of 0.067 and weighted average of 16.7%. Similarly, the statistical analysis conducted on geographies consisting of 159,460,125 people shows a poor negative correlation between the proportion of Icelanders and percentage of population receiving government assistance and/or food stamps in the United States with a correlation coefficient (R) of -0.154 and weighted average of 10.5%, a difference of 59.3%.
Receiving Food Stamps Correlation Summary
| Measurement | Guyanese | Icelander |
| Minimum | 1.0% | 1.4% |
| Maximum | 36.6% | 30.2% |
| Range | 35.6% | 28.8% |
| Mean | 15.6% | 9.6% |
| Median | 14.4% | 7.8% |
| Interquartile 25% (IQ1) | 10.6% | 5.5% |
| Interquartile 75% (IQ3) | 20.0% | 13.6% |
| Interquartile Range (IQR) | 9.4% | 8.1% |
| Standard Deviation (Sample) | 7.1% | 6.4% |
| Standard Deviation (Population) | 7.1% | 6.3% |
Similar Demographics by Receiving Food Stamps
Demographics Similar to Guyanese by Receiving Food Stamps
In terms of receiving food stamps, the demographic groups most similar to Guyanese are Immigrants from Barbados (16.6%, a difference of 0.52%), Sioux (16.8%, a difference of 0.70%), Immigrants from Jamaica (16.9%, a difference of 0.98%), U.S. Virgin Islander (16.5%, a difference of 1.1%), and Immigrants from Guyana (16.9%, a difference of 1.2%).
| Demographics | Rating | Rank | Receiving Food Stamps |
| West Indians | 0.0 /100 | #304 | Tragic 16.3% |
| Immigrants | Azores | 0.0 /100 | #305 | Tragic 16.4% |
| Jamaicans | 0.0 /100 | #306 | Tragic 16.4% |
| Houma | 0.0 /100 | #307 | Tragic 16.5% |
| Barbadians | 0.0 /100 | #308 | Tragic 16.5% |
| U.S. Virgin Islanders | 0.0 /100 | #309 | Tragic 16.5% |
| Immigrants | Barbados | 0.0 /100 | #310 | Tragic 16.6% |
| Guyanese | 0.0 /100 | #311 | Tragic 16.7% |
| Sioux | 0.0 /100 | #312 | Tragic 16.8% |
| Immigrants | Jamaica | 0.0 /100 | #313 | Tragic 16.9% |
| Immigrants | Guyana | 0.0 /100 | #314 | Tragic 16.9% |
| Bahamians | 0.0 /100 | #315 | Tragic 17.0% |
| Central American Indians | 0.0 /100 | #316 | Tragic 17.1% |
| Blacks/African Americans | 0.0 /100 | #317 | Tragic 17.2% |
| Menominee | 0.0 /100 | #318 | Tragic 17.2% |
Demographics Similar to Icelanders by Receiving Food Stamps
In terms of receiving food stamps, the demographic groups most similar to Icelanders are Scotch-Irish (10.5%, a difference of 0.30%), Mongolian (10.5%, a difference of 0.38%), Romanian (10.4%, a difference of 0.39%), Immigrants from Saudi Arabia (10.5%, a difference of 0.48%), and Pakistani (10.4%, a difference of 0.49%).
| Demographics | Rating | Rank | Receiving Food Stamps |
| Immigrants | Italy | 96.4 /100 | #106 | Exceptional 10.4% |
| Koreans | 96.3 /100 | #107 | Exceptional 10.4% |
| Carpatho Rusyns | 96.2 /100 | #108 | Exceptional 10.4% |
| Immigrants | Pakistan | 96.2 /100 | #109 | Exceptional 10.4% |
| Pakistanis | 95.9 /100 | #110 | Exceptional 10.4% |
| Romanians | 95.8 /100 | #111 | Exceptional 10.4% |
| Mongolians | 95.8 /100 | #112 | Exceptional 10.5% |
| Icelanders | 95.4 /100 | #113 | Exceptional 10.5% |
| Scotch-Irish | 95.1 /100 | #114 | Exceptional 10.5% |
| Immigrants | Saudi Arabia | 94.9 /100 | #115 | Exceptional 10.5% |
| Canadians | 94.8 /100 | #116 | Exceptional 10.5% |
| Immigrants | Nepal | 94.6 /100 | #117 | Exceptional 10.6% |
| Assyrians/Chaldeans/Syriacs | 94.1 /100 | #118 | Exceptional 10.6% |
| Immigrants | Poland | 93.9 /100 | #119 | Exceptional 10.6% |
| Ethiopians | 93.9 /100 | #120 | Exceptional 10.6% |