Guyanese vs Immigrants from Uganda Seniors Poverty Over the Age of 75
COMPARE
Guyanese
Immigrants from Uganda
Seniors Poverty Over the Age of 75
Seniors Poverty Over the Age of 75 Comparison
Guyanese
Immigrants from Uganda
16.1%
SENIORS POVERTY OVER THE AGE OF 75
0.0/ 100
METRIC RATING
315th/ 347
METRIC RANK
11.8%
SENIORS POVERTY OVER THE AGE OF 75
84.8/ 100
METRIC RATING
119th/ 347
METRIC RANK
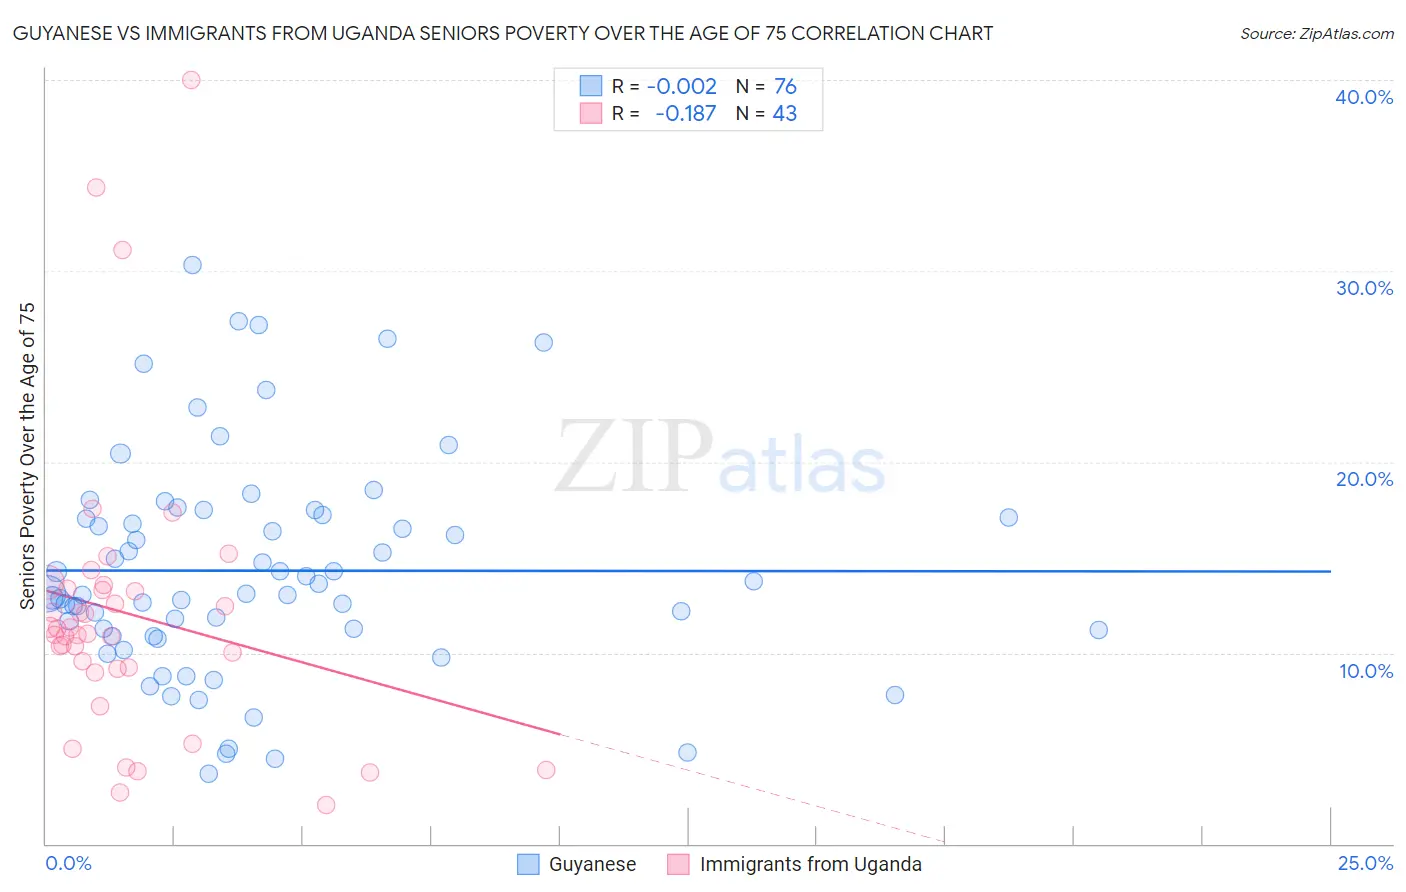
Guyanese vs Immigrants from Uganda Seniors Poverty Over the Age of 75 Correlation Chart
The statistical analysis conducted on geographies consisting of 175,791,386 people shows no correlation between the proportion of Guyanese and poverty level among seniors over the age of 75 in the United States with a correlation coefficient (R) of -0.002 and weighted average of 16.1%. Similarly, the statistical analysis conducted on geographies consisting of 125,579,986 people shows a poor negative correlation between the proportion of Immigrants from Uganda and poverty level among seniors over the age of 75 in the United States with a correlation coefficient (R) of -0.187 and weighted average of 11.8%, a difference of 37.0%.
Seniors Poverty Over the Age of 75 Correlation Summary
| Measurement | Guyanese | Immigrants from Uganda |
| Minimum | 3.7% | 2.1% |
| Maximum | 30.3% | 40.0% |
| Range | 26.6% | 37.9% |
| Mean | 14.3% | 12.0% |
| Median | 13.1% | 11.0% |
| Interquartile 25% (IQ1) | 11.0% | 9.2% |
| Interquartile 75% (IQ3) | 17.1% | 13.4% |
| Interquartile Range (IQR) | 6.1% | 4.2% |
| Standard Deviation (Sample) | 5.7% | 7.5% |
| Standard Deviation (Population) | 5.6% | 7.4% |
Similar Demographics by Seniors Poverty Over the Age of 75
Demographics Similar to Guyanese by Seniors Poverty Over the Age of 75
In terms of seniors poverty over the age of 75, the demographic groups most similar to Guyanese are Immigrants from Ecuador (16.1%, a difference of 0.010%), Tsimshian (16.1%, a difference of 0.30%), Immigrants from Guyana (16.2%, a difference of 0.62%), Barbadian (16.0%, a difference of 0.66%), and Houma (16.2%, a difference of 0.75%).
| Demographics | Rating | Rank | Seniors Poverty Over the Age of 75 |
| Immigrants | Bangladesh | 0.0 /100 | #308 | Tragic 15.8% |
| Yup'ik | 0.0 /100 | #309 | Tragic 15.8% |
| Vietnamese | 0.0 /100 | #310 | Tragic 15.9% |
| Trinidadians and Tobagonians | 0.0 /100 | #311 | Tragic 15.9% |
| Crow | 0.0 /100 | #312 | Tragic 15.9% |
| Barbadians | 0.0 /100 | #313 | Tragic 16.0% |
| Tsimshian | 0.0 /100 | #314 | Tragic 16.1% |
| Guyanese | 0.0 /100 | #315 | Tragic 16.1% |
| Immigrants | Ecuador | 0.0 /100 | #316 | Tragic 16.1% |
| Immigrants | Guyana | 0.0 /100 | #317 | Tragic 16.2% |
| Houma | 0.0 /100 | #318 | Tragic 16.2% |
| Haitians | 0.0 /100 | #319 | Tragic 16.2% |
| Immigrants | Yemen | 0.0 /100 | #320 | Tragic 16.5% |
| Immigrants | Haiti | 0.0 /100 | #321 | Tragic 16.5% |
| Immigrants | Barbados | 0.0 /100 | #322 | Tragic 16.5% |
Demographics Similar to Immigrants from Uganda by Seniors Poverty Over the Age of 75
In terms of seniors poverty over the age of 75, the demographic groups most similar to Immigrants from Uganda are Immigrants from Nepal (11.8%, a difference of 0.040%), Malaysian (11.8%, a difference of 0.11%), Pakistani (11.8%, a difference of 0.12%), Immigrants from Italy (11.8%, a difference of 0.12%), and Immigrants from Zimbabwe (11.7%, a difference of 0.13%).
| Demographics | Rating | Rank | Seniors Poverty Over the Age of 75 |
| Immigrants | Bolivia | 88.4 /100 | #112 | Excellent 11.7% |
| Immigrants | Czechoslovakia | 87.0 /100 | #113 | Excellent 11.7% |
| Ukrainians | 86.9 /100 | #114 | Excellent 11.7% |
| New Zealanders | 86.3 /100 | #115 | Excellent 11.7% |
| Iraqis | 86.3 /100 | #116 | Excellent 11.7% |
| Icelanders | 85.7 /100 | #117 | Excellent 11.7% |
| Immigrants | Zimbabwe | 85.5 /100 | #118 | Excellent 11.7% |
| Immigrants | Uganda | 84.8 /100 | #119 | Excellent 11.8% |
| Immigrants | Nepal | 84.5 /100 | #120 | Excellent 11.8% |
| Malaysians | 84.1 /100 | #121 | Excellent 11.8% |
| Pakistanis | 84.0 /100 | #122 | Excellent 11.8% |
| Immigrants | Italy | 84.0 /100 | #123 | Excellent 11.8% |
| Fijians | 83.8 /100 | #124 | Excellent 11.8% |
| Sudanese | 83.6 /100 | #125 | Excellent 11.8% |
| Pennsylvania Germans | 83.4 /100 | #126 | Excellent 11.8% |