Ottawa vs Immigrants from Uganda Single Mother Poverty
COMPARE
Ottawa
Immigrants from Uganda
Single Mother Poverty
Single Mother Poverty Comparison
Ottawa
Immigrants from Uganda
35.5%
SINGLE MOTHER POVERTY
0.0/ 100
METRIC RATING
324th/ 347
METRIC RANK
28.3%
SINGLE MOTHER POVERTY
92.5/ 100
METRIC RATING
116th/ 347
METRIC RANK
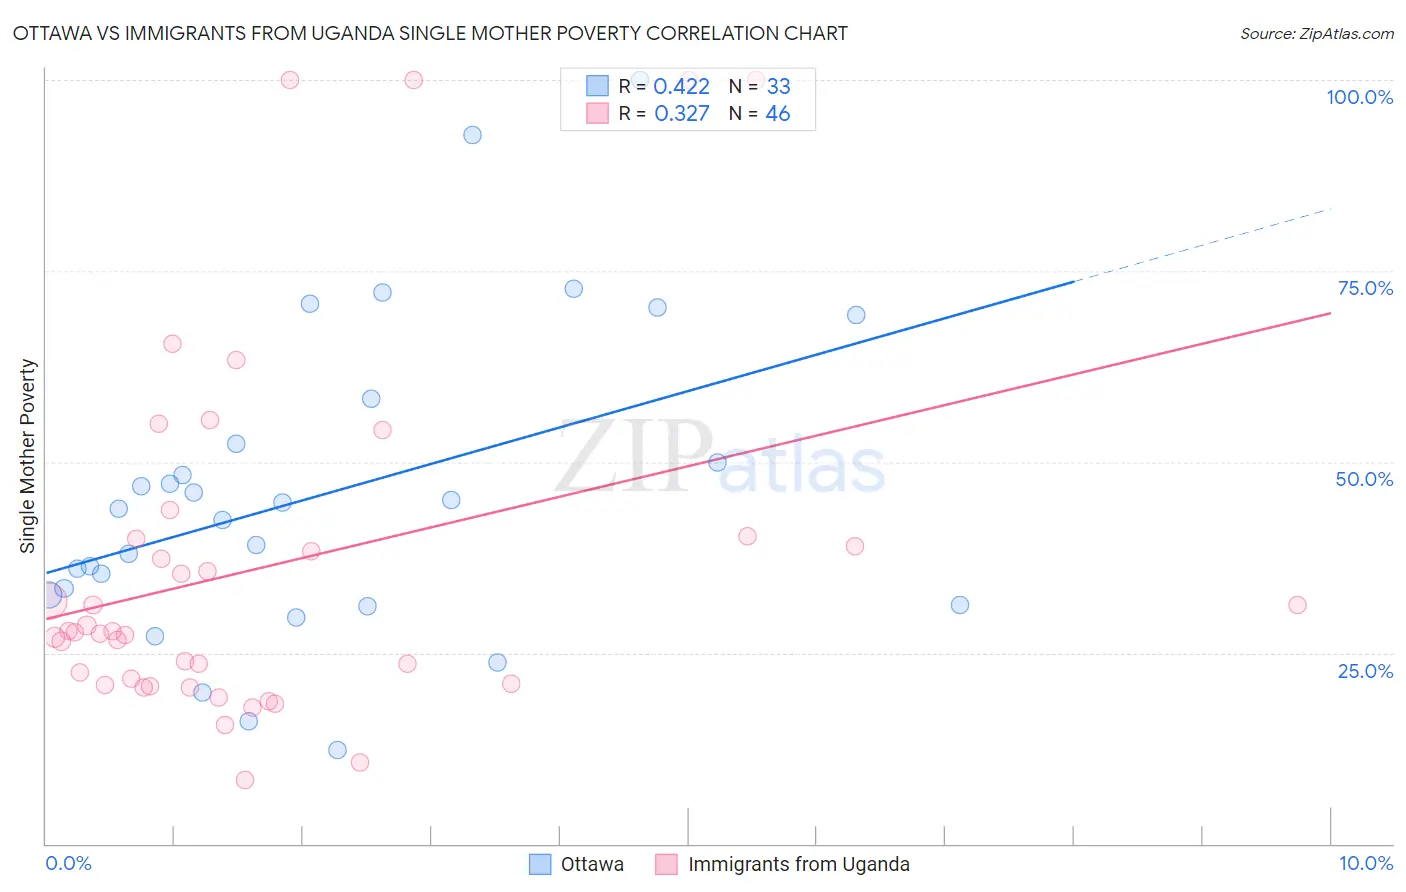
Ottawa vs Immigrants from Uganda Single Mother Poverty Correlation Chart
The statistical analysis conducted on geographies consisting of 49,602,464 people shows a moderate positive correlation between the proportion of Ottawa and poverty level among single mothers in the United States with a correlation coefficient (R) of 0.422 and weighted average of 35.5%. Similarly, the statistical analysis conducted on geographies consisting of 125,043,524 people shows a mild positive correlation between the proportion of Immigrants from Uganda and poverty level among single mothers in the United States with a correlation coefficient (R) of 0.327 and weighted average of 28.3%, a difference of 25.6%.
Single Mother Poverty Correlation Summary
| Measurement | Ottawa | Immigrants from Uganda |
| Minimum | 12.2% | 8.4% |
| Maximum | 100.0% | 100.0% |
| Range | 87.8% | 91.6% |
| Mean | 45.9% | 36.3% |
| Median | 43.8% | 27.8% |
| Interquartile 25% (IQ1) | 31.9% | 21.0% |
| Interquartile 75% (IQ3) | 55.3% | 40.0% |
| Interquartile Range (IQR) | 23.5% | 19.0% |
| Standard Deviation (Sample) | 20.6% | 23.6% |
| Standard Deviation (Population) | 20.3% | 23.3% |
Similar Demographics by Single Mother Poverty
Demographics Similar to Ottawa by Single Mother Poverty
In terms of single mother poverty, the demographic groups most similar to Ottawa are Kiowa (35.5%, a difference of 0.21%), Ute (35.7%, a difference of 0.48%), Seminole (35.8%, a difference of 0.78%), Black/African American (35.2%, a difference of 0.92%), and Paiute (35.1%, a difference of 1.1%).
| Demographics | Rating | Rank | Single Mother Poverty |
| Cherokee | 0.0 /100 | #317 | Tragic 34.5% |
| Immigrants | Honduras | 0.0 /100 | #318 | Tragic 34.7% |
| Chippewa | 0.0 /100 | #319 | Tragic 34.8% |
| Iroquois | 0.0 /100 | #320 | Tragic 34.8% |
| Paiute | 0.0 /100 | #321 | Tragic 35.1% |
| Blacks/African Americans | 0.0 /100 | #322 | Tragic 35.2% |
| Kiowa | 0.0 /100 | #323 | Tragic 35.5% |
| Ottawa | 0.0 /100 | #324 | Tragic 35.5% |
| Ute | 0.0 /100 | #325 | Tragic 35.7% |
| Seminole | 0.0 /100 | #326 | Tragic 35.8% |
| Yakama | 0.0 /100 | #327 | Tragic 36.4% |
| Choctaw | 0.0 /100 | #328 | Tragic 36.4% |
| Apache | 0.0 /100 | #329 | Tragic 36.6% |
| Natives/Alaskans | 0.0 /100 | #330 | Tragic 36.6% |
| Creek | 0.0 /100 | #331 | Tragic 36.7% |
Demographics Similar to Immigrants from Uganda by Single Mother Poverty
In terms of single mother poverty, the demographic groups most similar to Immigrants from Uganda are Australian (28.3%, a difference of 0.010%), Immigrants from Kuwait (28.3%, a difference of 0.020%), Brazilian (28.3%, a difference of 0.020%), Immigrants from Western Asia (28.3%, a difference of 0.030%), and Immigrants from Syria (28.3%, a difference of 0.030%).
| Demographics | Rating | Rank | Single Mother Poverty |
| Immigrants | Armenia | 95.2 /100 | #109 | Exceptional 28.1% |
| Croatians | 94.8 /100 | #110 | Exceptional 28.2% |
| Venezuelans | 94.5 /100 | #111 | Exceptional 28.2% |
| Immigrants | Kazakhstan | 94.5 /100 | #112 | Exceptional 28.2% |
| Immigrants | South Africa | 93.2 /100 | #113 | Exceptional 28.3% |
| Immigrants | Western Asia | 92.7 /100 | #114 | Exceptional 28.3% |
| Immigrants | Kuwait | 92.7 /100 | #115 | Exceptional 28.3% |
| Immigrants | Uganda | 92.5 /100 | #116 | Exceptional 28.3% |
| Australians | 92.5 /100 | #117 | Exceptional 28.3% |
| Brazilians | 92.4 /100 | #118 | Exceptional 28.3% |
| Immigrants | Syria | 92.4 /100 | #119 | Exceptional 28.3% |
| Cypriots | 92.3 /100 | #120 | Exceptional 28.3% |
| Immigrants | Afghanistan | 92.1 /100 | #121 | Exceptional 28.3% |
| Colombians | 91.8 /100 | #122 | Exceptional 28.3% |
| Uruguayans | 91.7 /100 | #123 | Exceptional 28.3% |