Native/Alaskan vs Immigrants from Uganda Single Mother Poverty
COMPARE
Native/Alaskan
Immigrants from Uganda
Single Mother Poverty
Single Mother Poverty Comparison
Natives/Alaskans
Immigrants from Uganda
36.6%
SINGLE MOTHER POVERTY
0.0/ 100
METRIC RATING
330th/ 347
METRIC RANK
28.3%
SINGLE MOTHER POVERTY
92.5/ 100
METRIC RATING
116th/ 347
METRIC RANK
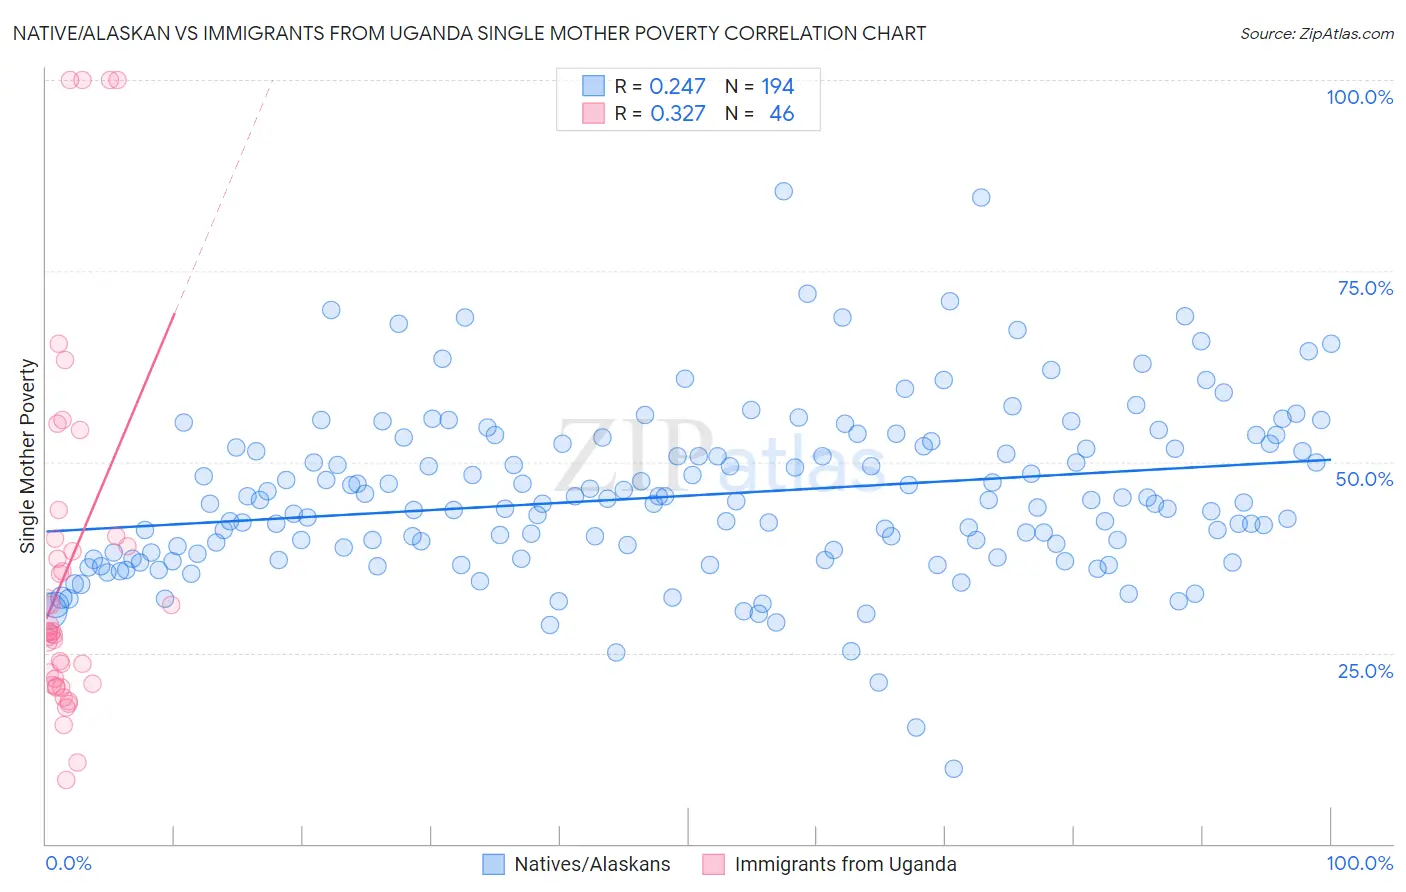
Native/Alaskan vs Immigrants from Uganda Single Mother Poverty Correlation Chart
The statistical analysis conducted on geographies consisting of 497,815,701 people shows a weak positive correlation between the proportion of Natives/Alaskans and poverty level among single mothers in the United States with a correlation coefficient (R) of 0.247 and weighted average of 36.6%. Similarly, the statistical analysis conducted on geographies consisting of 125,043,524 people shows a mild positive correlation between the proportion of Immigrants from Uganda and poverty level among single mothers in the United States with a correlation coefficient (R) of 0.327 and weighted average of 28.3%, a difference of 29.5%.
Single Mother Poverty Correlation Summary
| Measurement | Native/Alaskan | Immigrants from Uganda |
| Minimum | 9.8% | 8.4% |
| Maximum | 85.4% | 100.0% |
| Range | 75.6% | 91.6% |
| Mean | 45.6% | 36.3% |
| Median | 44.6% | 27.8% |
| Interquartile 25% (IQ1) | 37.9% | 21.0% |
| Interquartile 75% (IQ3) | 52.0% | 40.0% |
| Interquartile Range (IQR) | 14.1% | 19.0% |
| Standard Deviation (Sample) | 11.2% | 23.6% |
| Standard Deviation (Population) | 11.2% | 23.3% |
Similar Demographics by Single Mother Poverty
Demographics Similar to Natives/Alaskans by Single Mother Poverty
In terms of single mother poverty, the demographic groups most similar to Natives/Alaskans are Apache (36.6%, a difference of 0.10%), Creek (36.7%, a difference of 0.16%), Dutch West Indian (36.8%, a difference of 0.40%), Choctaw (36.4%, a difference of 0.58%), and Yakama (36.4%, a difference of 0.64%).
| Demographics | Rating | Rank | Single Mother Poverty |
| Kiowa | 0.0 /100 | #323 | Tragic 35.5% |
| Ottawa | 0.0 /100 | #324 | Tragic 35.5% |
| Ute | 0.0 /100 | #325 | Tragic 35.7% |
| Seminole | 0.0 /100 | #326 | Tragic 35.8% |
| Yakama | 0.0 /100 | #327 | Tragic 36.4% |
| Choctaw | 0.0 /100 | #328 | Tragic 36.4% |
| Apache | 0.0 /100 | #329 | Tragic 36.6% |
| Natives/Alaskans | 0.0 /100 | #330 | Tragic 36.6% |
| Creek | 0.0 /100 | #331 | Tragic 36.7% |
| Dutch West Indians | 0.0 /100 | #332 | Tragic 36.8% |
| Menominee | 0.0 /100 | #333 | Tragic 37.1% |
| Pueblo | 0.0 /100 | #334 | Tragic 37.2% |
| Yuman | 0.0 /100 | #335 | Tragic 37.8% |
| Cheyenne | 0.0 /100 | #336 | Tragic 38.5% |
| Immigrants | Yemen | 0.0 /100 | #337 | Tragic 38.5% |
Demographics Similar to Immigrants from Uganda by Single Mother Poverty
In terms of single mother poverty, the demographic groups most similar to Immigrants from Uganda are Australian (28.3%, a difference of 0.010%), Immigrants from Kuwait (28.3%, a difference of 0.020%), Brazilian (28.3%, a difference of 0.020%), Immigrants from Western Asia (28.3%, a difference of 0.030%), and Immigrants from Syria (28.3%, a difference of 0.030%).
| Demographics | Rating | Rank | Single Mother Poverty |
| Immigrants | Armenia | 95.2 /100 | #109 | Exceptional 28.1% |
| Croatians | 94.8 /100 | #110 | Exceptional 28.2% |
| Venezuelans | 94.5 /100 | #111 | Exceptional 28.2% |
| Immigrants | Kazakhstan | 94.5 /100 | #112 | Exceptional 28.2% |
| Immigrants | South Africa | 93.2 /100 | #113 | Exceptional 28.3% |
| Immigrants | Western Asia | 92.7 /100 | #114 | Exceptional 28.3% |
| Immigrants | Kuwait | 92.7 /100 | #115 | Exceptional 28.3% |
| Immigrants | Uganda | 92.5 /100 | #116 | Exceptional 28.3% |
| Australians | 92.5 /100 | #117 | Exceptional 28.3% |
| Brazilians | 92.4 /100 | #118 | Exceptional 28.3% |
| Immigrants | Syria | 92.4 /100 | #119 | Exceptional 28.3% |
| Cypriots | 92.3 /100 | #120 | Exceptional 28.3% |
| Immigrants | Afghanistan | 92.1 /100 | #121 | Exceptional 28.3% |
| Colombians | 91.8 /100 | #122 | Exceptional 28.3% |
| Uruguayans | 91.7 /100 | #123 | Exceptional 28.3% |