Paraguayan vs Immigrants from Sudan Single Mother Poverty
COMPARE
Paraguayan
Immigrants from Sudan
Single Mother Poverty
Single Mother Poverty Comparison
Paraguayans
Immigrants from Sudan
27.2%
SINGLE MOTHER POVERTY
99.6/ 100
METRIC RATING
59th/ 347
METRIC RANK
30.1%
SINGLE MOTHER POVERTY
6.5/ 100
METRIC RATING
224th/ 347
METRIC RANK
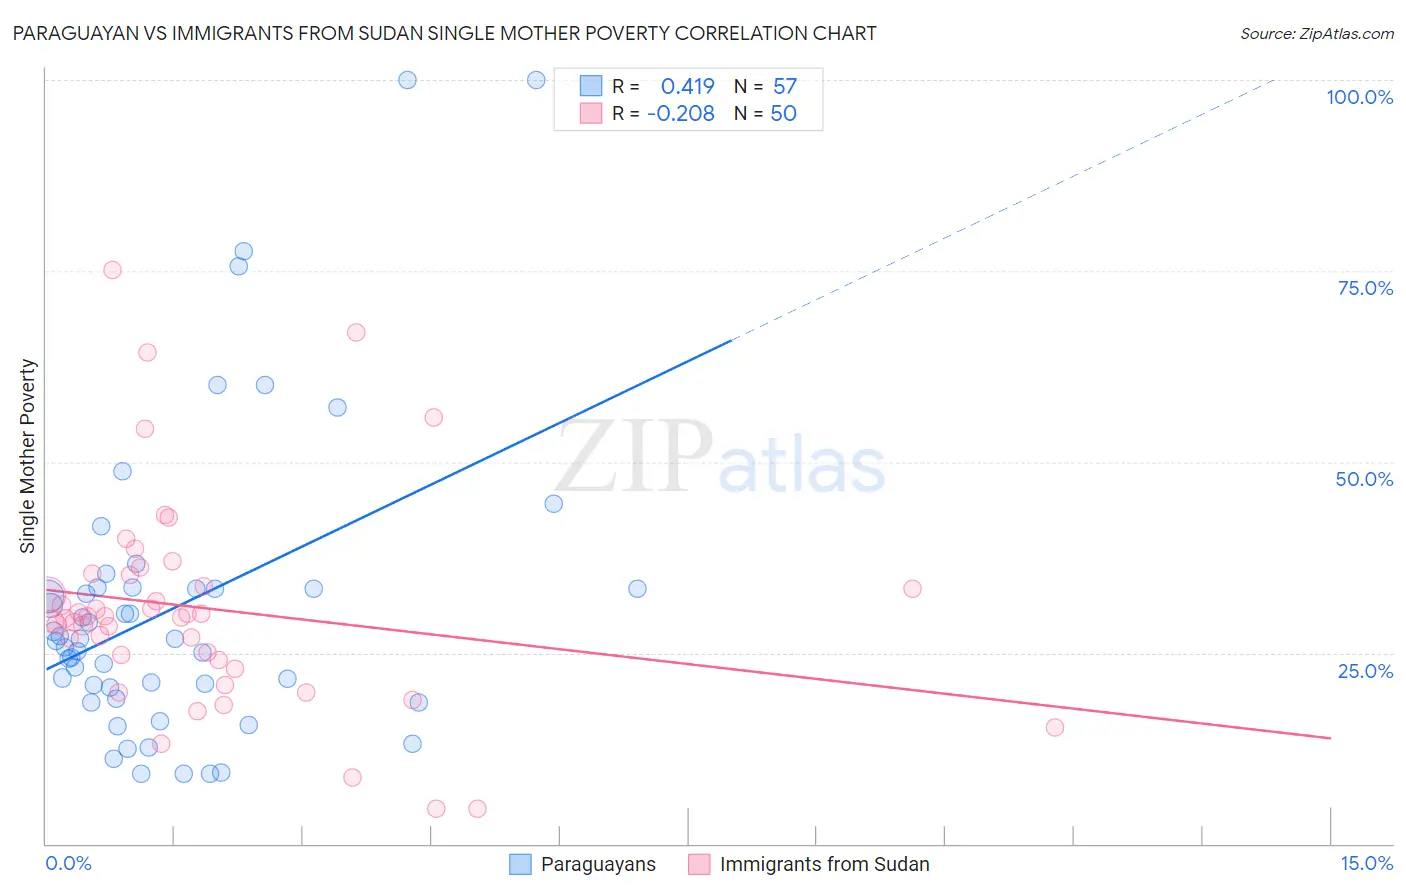
Paraguayan vs Immigrants from Sudan Single Mother Poverty Correlation Chart
The statistical analysis conducted on geographies consisting of 94,301,501 people shows a moderate positive correlation between the proportion of Paraguayans and poverty level among single mothers in the United States with a correlation coefficient (R) of 0.419 and weighted average of 27.2%. Similarly, the statistical analysis conducted on geographies consisting of 118,210,366 people shows a weak negative correlation between the proportion of Immigrants from Sudan and poverty level among single mothers in the United States with a correlation coefficient (R) of -0.208 and weighted average of 30.1%, a difference of 10.6%.
Single Mother Poverty Correlation Summary
| Measurement | Paraguayan | Immigrants from Sudan |
| Minimum | 9.1% | 4.5% |
| Maximum | 100.0% | 75.1% |
| Range | 90.9% | 70.6% |
| Mean | 31.1% | 30.8% |
| Median | 26.8% | 29.7% |
| Interquartile 25% (IQ1) | 19.7% | 24.1% |
| Interquartile 75% (IQ3) | 33.4% | 35.2% |
| Interquartile Range (IQR) | 13.7% | 11.1% |
| Standard Deviation (Sample) | 19.9% | 14.0% |
| Standard Deviation (Population) | 19.7% | 13.9% |
Similar Demographics by Single Mother Poverty
Demographics Similar to Paraguayans by Single Mother Poverty
In terms of single mother poverty, the demographic groups most similar to Paraguayans are Argentinean (27.2%, a difference of 0.010%), Eastern European (27.2%, a difference of 0.040%), Immigrants from Eastern Europe (27.2%, a difference of 0.15%), Palestinian (27.2%, a difference of 0.17%), and Immigrants from Romania (27.2%, a difference of 0.20%).
| Demographics | Rating | Rank | Single Mother Poverty |
| Immigrants | South Eastern Asia | 99.7 /100 | #52 | Exceptional 27.1% |
| Immigrants | Jordan | 99.7 /100 | #53 | Exceptional 27.1% |
| Immigrants | Bulgaria | 99.7 /100 | #54 | Exceptional 27.1% |
| Immigrants | Egypt | 99.7 /100 | #55 | Exceptional 27.1% |
| Immigrants | Romania | 99.7 /100 | #56 | Exceptional 27.2% |
| Palestinians | 99.7 /100 | #57 | Exceptional 27.2% |
| Argentineans | 99.6 /100 | #58 | Exceptional 27.2% |
| Paraguayans | 99.6 /100 | #59 | Exceptional 27.2% |
| Eastern Europeans | 99.6 /100 | #60 | Exceptional 27.2% |
| Immigrants | Eastern Europe | 99.6 /100 | #61 | Exceptional 27.2% |
| Immigrants | Malaysia | 99.5 /100 | #62 | Exceptional 27.3% |
| Immigrants | Northern Europe | 99.5 /100 | #63 | Exceptional 27.3% |
| Russians | 99.5 /100 | #64 | Exceptional 27.3% |
| Immigrants | Turkey | 99.5 /100 | #65 | Exceptional 27.3% |
| Soviet Union | 99.5 /100 | #66 | Exceptional 27.3% |
Demographics Similar to Immigrants from Sudan by Single Mother Poverty
In terms of single mother poverty, the demographic groups most similar to Immigrants from Sudan are Spanish (30.1%, a difference of 0.030%), Immigrants from Cuba (30.1%, a difference of 0.070%), Scottish (30.1%, a difference of 0.090%), Immigrants from Liberia (30.1%, a difference of 0.12%), and Sudanese (30.0%, a difference of 0.20%).
| Demographics | Rating | Rank | Single Mother Poverty |
| Immigrants | Ghana | 11.3 /100 | #217 | Poor 29.9% |
| Hungarians | 10.3 /100 | #218 | Poor 29.9% |
| Finns | 9.3 /100 | #219 | Tragic 30.0% |
| Germans | 8.8 /100 | #220 | Tragic 30.0% |
| Immigrants | Eritrea | 7.7 /100 | #221 | Tragic 30.0% |
| Sudanese | 7.6 /100 | #222 | Tragic 30.0% |
| Immigrants | Cuba | 6.9 /100 | #223 | Tragic 30.1% |
| Immigrants | Sudan | 6.5 /100 | #224 | Tragic 30.1% |
| Spanish | 6.3 /100 | #225 | Tragic 30.1% |
| Scottish | 6.0 /100 | #226 | Tragic 30.1% |
| Immigrants | Liberia | 5.9 /100 | #227 | Tragic 30.1% |
| Spaniards | 5.4 /100 | #228 | Tragic 30.2% |
| Immigrants | Barbados | 5.0 /100 | #229 | Tragic 30.2% |
| English | 4.8 /100 | #230 | Tragic 30.2% |
| Dutch | 4.3 /100 | #231 | Tragic 30.2% |