Guyanese vs Immigrants from Sudan Professional Degree
COMPARE
Guyanese
Immigrants from Sudan
Professional Degree
Professional Degree Comparison
Guyanese
Immigrants from Sudan
3.8%
PROFESSIONAL DEGREE
1.6/ 100
METRIC RATING
247th/ 347
METRIC RANK
4.9%
PROFESSIONAL DEGREE
95.4/ 100
METRIC RATING
119th/ 347
METRIC RANK
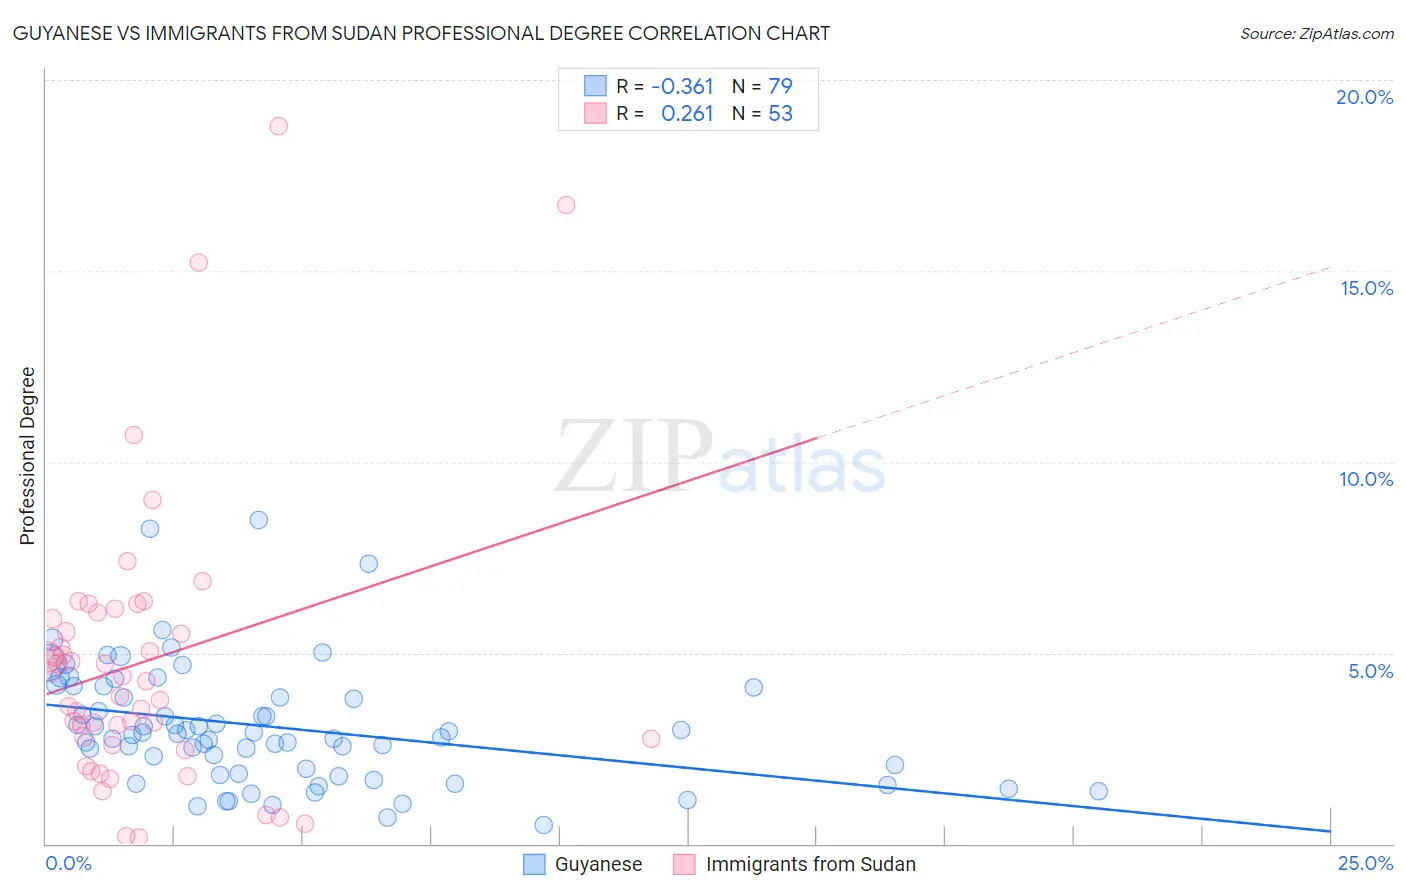
Guyanese vs Immigrants from Sudan Professional Degree Correlation Chart
The statistical analysis conducted on geographies consisting of 176,751,044 people shows a mild negative correlation between the proportion of Guyanese and percentage of population with at least professional degree education in the United States with a correlation coefficient (R) of -0.361 and weighted average of 3.8%. Similarly, the statistical analysis conducted on geographies consisting of 118,905,471 people shows a weak positive correlation between the proportion of Immigrants from Sudan and percentage of population with at least professional degree education in the United States with a correlation coefficient (R) of 0.261 and weighted average of 4.9%, a difference of 30.3%.
Professional Degree Correlation Summary
| Measurement | Guyanese | Immigrants from Sudan |
| Minimum | 0.51% | 0.17% |
| Maximum | 8.5% | 18.8% |
| Range | 8.0% | 18.6% |
| Mean | 3.1% | 4.8% |
| Median | 2.9% | 4.2% |
| Interquartile 25% (IQ1) | 1.8% | 2.7% |
| Interquartile 75% (IQ3) | 4.1% | 6.0% |
| Interquartile Range (IQR) | 2.3% | 3.3% |
| Standard Deviation (Sample) | 1.6% | 3.7% |
| Standard Deviation (Population) | 1.6% | 3.7% |
Similar Demographics by Professional Degree
Demographics Similar to Guyanese by Professional Degree
In terms of professional degree, the demographic groups most similar to Guyanese are Marshallese (3.8%, a difference of 0.020%), Hmong (3.7%, a difference of 0.16%), French American Indian (3.8%, a difference of 0.20%), Immigrants from Grenada (3.7%, a difference of 0.27%), and Immigrants from Fiji (3.7%, a difference of 0.34%).
| Demographics | Rating | Rank | Professional Degree |
| Immigrants | Ecuador | 2.3 /100 | #240 | Tragic 3.8% |
| Alaskan Athabascans | 2.3 /100 | #241 | Tragic 3.8% |
| Native Hawaiians | 2.3 /100 | #242 | Tragic 3.8% |
| Guamanians/Chamorros | 2.2 /100 | #243 | Tragic 3.8% |
| Immigrants | Bahamas | 2.0 /100 | #244 | Tragic 3.8% |
| French American Indians | 1.7 /100 | #245 | Tragic 3.8% |
| Marshallese | 1.7 /100 | #246 | Tragic 3.8% |
| Guyanese | 1.6 /100 | #247 | Tragic 3.8% |
| Hmong | 1.6 /100 | #248 | Tragic 3.7% |
| Immigrants | Grenada | 1.5 /100 | #249 | Tragic 3.7% |
| Immigrants | Fiji | 1.5 /100 | #250 | Tragic 3.7% |
| Immigrants | Nicaragua | 1.4 /100 | #251 | Tragic 3.7% |
| Jamaicans | 1.4 /100 | #252 | Tragic 3.7% |
| Pueblo | 1.4 /100 | #253 | Tragic 3.7% |
| Tongans | 1.3 /100 | #254 | Tragic 3.7% |
Demographics Similar to Immigrants from Sudan by Professional Degree
In terms of professional degree, the demographic groups most similar to Immigrants from Sudan are Albanian (4.9%, a difference of 0.010%), Immigrants from Moldova (4.9%, a difference of 0.36%), Immigrants from Syria (4.9%, a difference of 0.54%), Croatian (4.9%, a difference of 0.54%), and Venezuelan (4.9%, a difference of 0.75%).
| Demographics | Rating | Rank | Professional Degree |
| Taiwanese | 97.3 /100 | #112 | Exceptional 5.0% |
| Immigrants | Pakistan | 97.2 /100 | #113 | Exceptional 5.0% |
| Immigrants | Morocco | 96.8 /100 | #114 | Exceptional 5.0% |
| Moroccans | 96.8 /100 | #115 | Exceptional 5.0% |
| Venezuelans | 96.3 /100 | #116 | Exceptional 4.9% |
| Immigrants | Syria | 96.0 /100 | #117 | Exceptional 4.9% |
| Croatians | 96.0 /100 | #118 | Exceptional 4.9% |
| Immigrants | Sudan | 95.4 /100 | #119 | Exceptional 4.9% |
| Albanians | 95.3 /100 | #120 | Exceptional 4.9% |
| Immigrants | Moldova | 94.8 /100 | #121 | Exceptional 4.9% |
| Immigrants | Germany | 94.1 /100 | #122 | Exceptional 4.9% |
| Immigrants | Venezuela | 93.8 /100 | #123 | Exceptional 4.8% |
| Immigrants | Eritrea | 93.5 /100 | #124 | Exceptional 4.8% |
| Immigrants | Albania | 93.3 /100 | #125 | Exceptional 4.8% |
| Europeans | 93.2 /100 | #126 | Exceptional 4.8% |