Guyanese vs Immigrants from Sudan 2nd Grade
COMPARE
Guyanese
Immigrants from Sudan
2nd Grade
2nd Grade Comparison
Guyanese
Immigrants from Sudan
96.8%
2ND GRADE
0.0/ 100
METRIC RATING
311th/ 347
METRIC RANK
97.6%
2ND GRADE
4.5/ 100
METRIC RATING
222nd/ 347
METRIC RANK
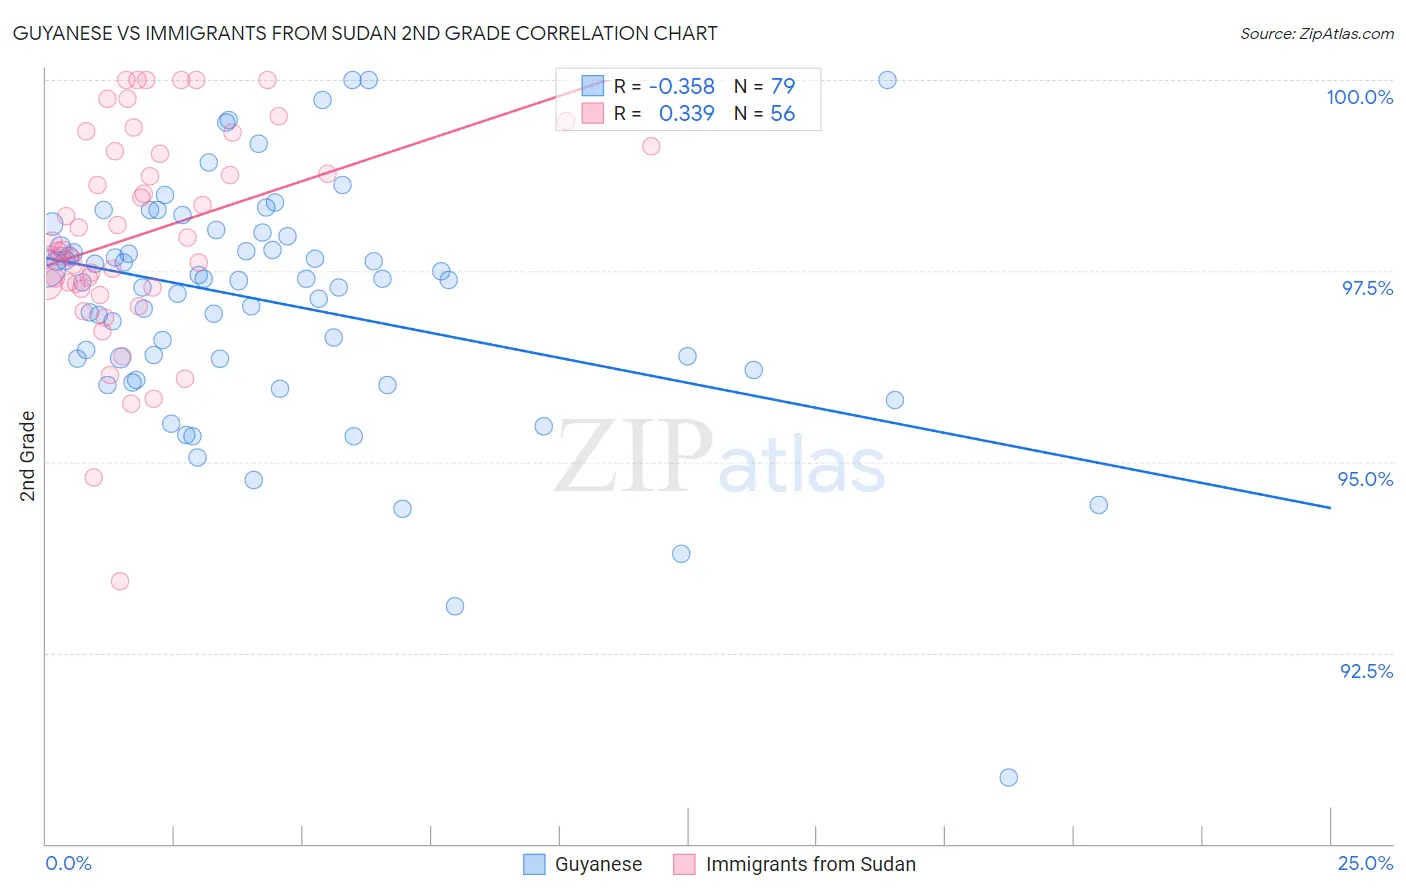
Guyanese vs Immigrants from Sudan 2nd Grade Correlation Chart
The statistical analysis conducted on geographies consisting of 176,921,765 people shows a mild negative correlation between the proportion of Guyanese and percentage of population with at least 2nd grade education in the United States with a correlation coefficient (R) of -0.358 and weighted average of 96.8%. Similarly, the statistical analysis conducted on geographies consisting of 118,957,985 people shows a mild positive correlation between the proportion of Immigrants from Sudan and percentage of population with at least 2nd grade education in the United States with a correlation coefficient (R) of 0.339 and weighted average of 97.6%, a difference of 0.83%.
2nd Grade Correlation Summary
| Measurement | Guyanese | Immigrants from Sudan |
| Minimum | 90.9% | 93.4% |
| Maximum | 100.0% | 100.0% |
| Range | 9.1% | 6.6% |
| Mean | 97.1% | 98.0% |
| Median | 97.4% | 97.8% |
| Interquartile 25% (IQ1) | 96.4% | 97.3% |
| Interquartile 75% (IQ3) | 98.0% | 99.1% |
| Interquartile Range (IQR) | 1.6% | 1.8% |
| Standard Deviation (Sample) | 1.6% | 1.4% |
| Standard Deviation (Population) | 1.5% | 1.4% |
Similar Demographics by 2nd Grade
Demographics Similar to Guyanese by 2nd Grade
In terms of 2nd grade, the demographic groups most similar to Guyanese are Belizean (96.8%, a difference of 0.010%), Sri Lankan (96.8%, a difference of 0.010%), Cape Verdean (96.8%, a difference of 0.010%), Immigrants from the Azores (96.8%, a difference of 0.020%), and Immigrants from Haiti (96.8%, a difference of 0.020%).
| Demographics | Rating | Rank | 2nd Grade |
| Immigrants | Caribbean | 0.0 /100 | #304 | Tragic 96.9% |
| Nicaraguans | 0.0 /100 | #305 | Tragic 96.9% |
| Immigrants | Somalia | 0.0 /100 | #306 | Tragic 96.9% |
| Immigrants | Azores | 0.0 /100 | #307 | Tragic 96.8% |
| Immigrants | Haiti | 0.0 /100 | #308 | Tragic 96.8% |
| Belizeans | 0.0 /100 | #309 | Tragic 96.8% |
| Sri Lankans | 0.0 /100 | #310 | Tragic 96.8% |
| Guyanese | 0.0 /100 | #311 | Tragic 96.8% |
| Cape Verdeans | 0.0 /100 | #312 | Tragic 96.8% |
| Hispanics or Latinos | 0.0 /100 | #313 | Tragic 96.8% |
| Immigrants | Ecuador | 0.0 /100 | #314 | Tragic 96.8% |
| Immigrants | Belize | 0.0 /100 | #315 | Tragic 96.8% |
| Hondurans | 0.0 /100 | #316 | Tragic 96.7% |
| Immigrants | Laos | 0.0 /100 | #317 | Tragic 96.7% |
| Indonesians | 0.0 /100 | #318 | Tragic 96.7% |
Demographics Similar to Immigrants from Sudan by 2nd Grade
In terms of 2nd grade, the demographic groups most similar to Immigrants from Sudan are Iraqi (97.6%, a difference of 0.0%), Sierra Leonean (97.6%, a difference of 0.0%), Immigrants from Zaire (97.6%, a difference of 0.0%), Tongan (97.6%, a difference of 0.0%), and Immigrants from Panama (97.6%, a difference of 0.010%).
| Demographics | Rating | Rank | 2nd Grade |
| Bahamians | 6.8 /100 | #215 | Tragic 97.7% |
| South American Indians | 6.7 /100 | #216 | Tragic 97.7% |
| Uruguayans | 6.2 /100 | #217 | Tragic 97.7% |
| Sudanese | 5.7 /100 | #218 | Tragic 97.7% |
| Immigrants | Panama | 5.1 /100 | #219 | Tragic 97.6% |
| Immigrants | Morocco | 5.0 /100 | #220 | Tragic 97.6% |
| Iraqis | 4.6 /100 | #221 | Tragic 97.6% |
| Immigrants | Sudan | 4.5 /100 | #222 | Tragic 97.6% |
| Sierra Leoneans | 4.3 /100 | #223 | Tragic 97.6% |
| Immigrants | Zaire | 4.3 /100 | #224 | Tragic 97.6% |
| Tongans | 4.3 /100 | #225 | Tragic 97.6% |
| Immigrants | Syria | 4.0 /100 | #226 | Tragic 97.6% |
| Immigrants | Nepal | 4.0 /100 | #227 | Tragic 97.6% |
| Sub-Saharan Africans | 3.4 /100 | #228 | Tragic 97.6% |
| Immigrants | Costa Rica | 3.1 /100 | #229 | Tragic 97.6% |