Nonimmigrants vs Immigrants from Sudan Single Mother Poverty
COMPARE
Nonimmigrants
Immigrants from Sudan
Single Mother Poverty
Single Mother Poverty Comparison
Nonimmigrants
Immigrants from Sudan
32.2%
SINGLE MOTHER POVERTY
0.0/ 100
METRIC RATING
280th/ 347
METRIC RANK
30.1%
SINGLE MOTHER POVERTY
6.5/ 100
METRIC RATING
224th/ 347
METRIC RANK
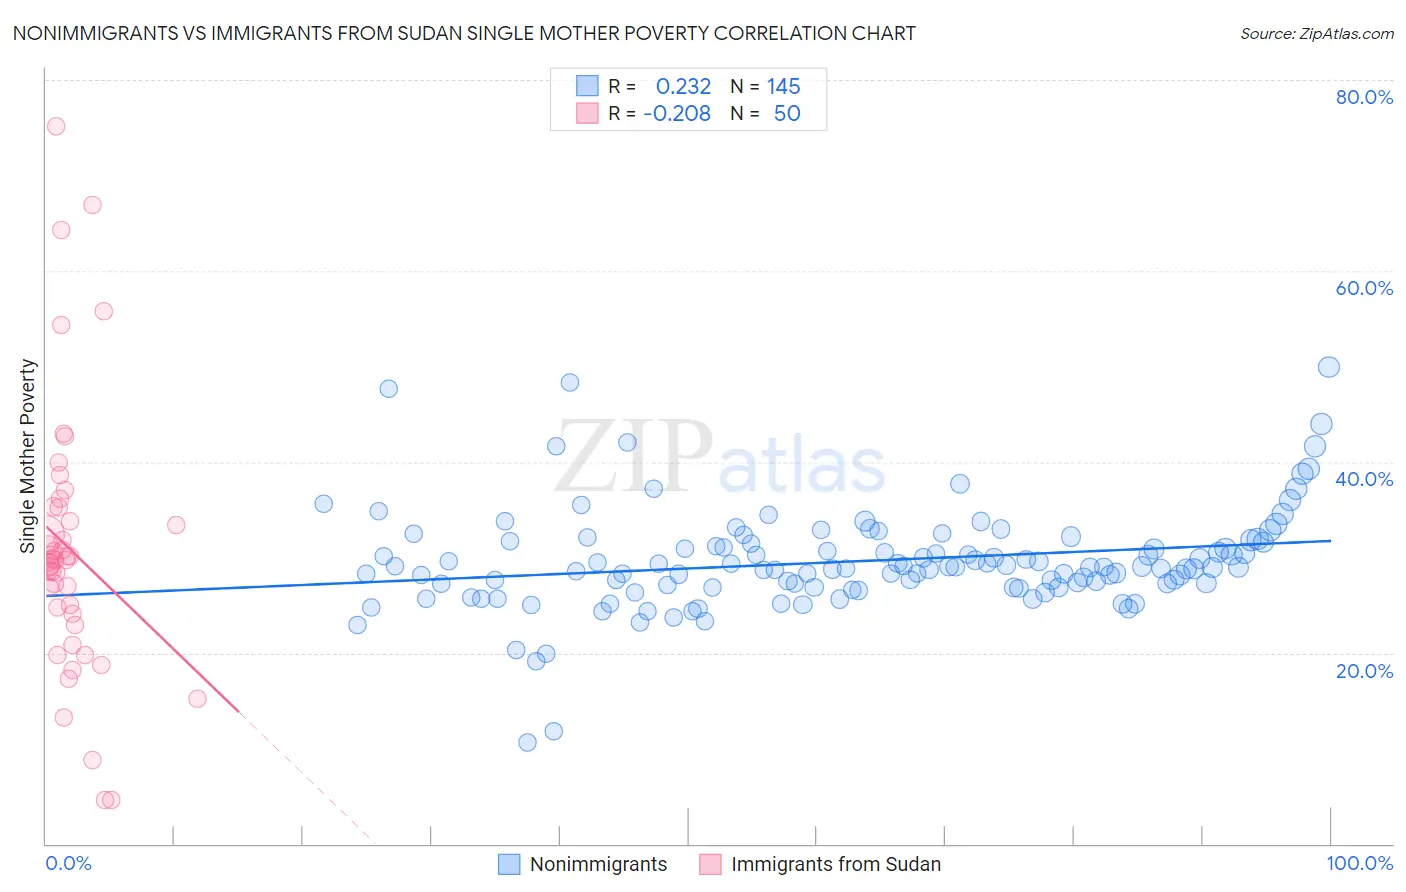
Nonimmigrants vs Immigrants from Sudan Single Mother Poverty Correlation Chart
The statistical analysis conducted on geographies consisting of 553,388,851 people shows a weak positive correlation between the proportion of Nonimmigrants and poverty level among single mothers in the United States with a correlation coefficient (R) of 0.232 and weighted average of 32.2%. Similarly, the statistical analysis conducted on geographies consisting of 118,210,366 people shows a weak negative correlation between the proportion of Immigrants from Sudan and poverty level among single mothers in the United States with a correlation coefficient (R) of -0.208 and weighted average of 30.1%, a difference of 6.9%.
Single Mother Poverty Correlation Summary
| Measurement | Nonimmigrants | Immigrants from Sudan |
| Minimum | 10.6% | 4.5% |
| Maximum | 49.9% | 75.1% |
| Range | 39.4% | 70.6% |
| Mean | 29.6% | 30.8% |
| Median | 29.0% | 29.7% |
| Interquartile 25% (IQ1) | 27.0% | 24.1% |
| Interquartile 75% (IQ3) | 31.7% | 35.2% |
| Interquartile Range (IQR) | 4.7% | 11.1% |
| Standard Deviation (Sample) | 5.4% | 14.0% |
| Standard Deviation (Population) | 5.4% | 13.9% |
Similar Demographics by Single Mother Poverty
Demographics Similar to Nonimmigrants by Single Mother Poverty
In terms of single mother poverty, the demographic groups most similar to Nonimmigrants are Cree (32.2%, a difference of 0.030%), Immigrants from the Azores (32.2%, a difference of 0.14%), Marshallese (32.1%, a difference of 0.22%), Spanish American (32.3%, a difference of 0.39%), and Immigrants from Zaire (32.0%, a difference of 0.62%).
| Demographics | Rating | Rank | Single Mother Poverty |
| Fijians | 0.1 /100 | #273 | Tragic 31.6% |
| Bangladeshis | 0.1 /100 | #274 | Tragic 31.7% |
| Central Americans | 0.1 /100 | #275 | Tragic 31.8% |
| Delaware | 0.0 /100 | #276 | Tragic 31.8% |
| Mexican American Indians | 0.0 /100 | #277 | Tragic 31.9% |
| Immigrants | Zaire | 0.0 /100 | #278 | Tragic 32.0% |
| Marshallese | 0.0 /100 | #279 | Tragic 32.1% |
| Immigrants | Nonimmigrants | 0.0 /100 | #280 | Tragic 32.2% |
| Cree | 0.0 /100 | #281 | Tragic 32.2% |
| Immigrants | Azores | 0.0 /100 | #282 | Tragic 32.2% |
| Spanish Americans | 0.0 /100 | #283 | Tragic 32.3% |
| Indonesians | 0.0 /100 | #284 | Tragic 32.4% |
| Immigrants | Latin America | 0.0 /100 | #285 | Tragic 32.4% |
| Yup'ik | 0.0 /100 | #286 | Tragic 32.5% |
| Immigrants | Dominica | 0.0 /100 | #287 | Tragic 32.5% |
Demographics Similar to Immigrants from Sudan by Single Mother Poverty
In terms of single mother poverty, the demographic groups most similar to Immigrants from Sudan are Spanish (30.1%, a difference of 0.030%), Immigrants from Cuba (30.1%, a difference of 0.070%), Scottish (30.1%, a difference of 0.090%), Immigrants from Liberia (30.1%, a difference of 0.12%), and Sudanese (30.0%, a difference of 0.20%).
| Demographics | Rating | Rank | Single Mother Poverty |
| Immigrants | Ghana | 11.3 /100 | #217 | Poor 29.9% |
| Hungarians | 10.3 /100 | #218 | Poor 29.9% |
| Finns | 9.3 /100 | #219 | Tragic 30.0% |
| Germans | 8.8 /100 | #220 | Tragic 30.0% |
| Immigrants | Eritrea | 7.7 /100 | #221 | Tragic 30.0% |
| Sudanese | 7.6 /100 | #222 | Tragic 30.0% |
| Immigrants | Cuba | 6.9 /100 | #223 | Tragic 30.1% |
| Immigrants | Sudan | 6.5 /100 | #224 | Tragic 30.1% |
| Spanish | 6.3 /100 | #225 | Tragic 30.1% |
| Scottish | 6.0 /100 | #226 | Tragic 30.1% |
| Immigrants | Liberia | 5.9 /100 | #227 | Tragic 30.1% |
| Spaniards | 5.4 /100 | #228 | Tragic 30.2% |
| Immigrants | Barbados | 5.0 /100 | #229 | Tragic 30.2% |
| English | 4.8 /100 | #230 | Tragic 30.2% |
| Dutch | 4.3 /100 | #231 | Tragic 30.2% |