Choctaw vs Immigrants from Sudan Single Mother Poverty
COMPARE
Choctaw
Immigrants from Sudan
Single Mother Poverty
Single Mother Poverty Comparison
Choctaw
Immigrants from Sudan
36.4%
SINGLE MOTHER POVERTY
0.0/ 100
METRIC RATING
328th/ 347
METRIC RANK
30.1%
SINGLE MOTHER POVERTY
6.5/ 100
METRIC RATING
224th/ 347
METRIC RANK
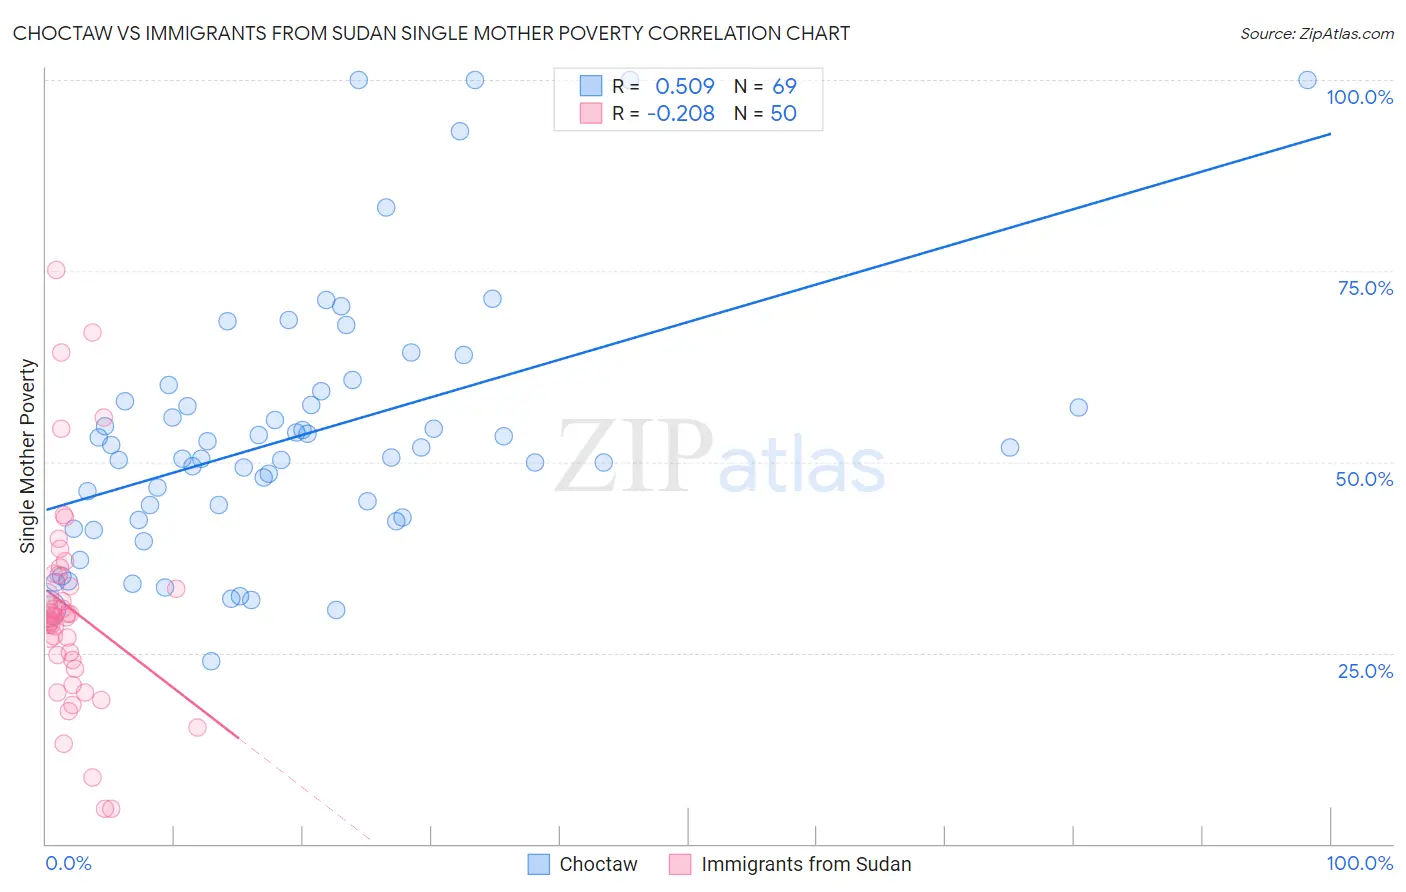
Choctaw vs Immigrants from Sudan Single Mother Poverty Correlation Chart
The statistical analysis conducted on geographies consisting of 266,090,747 people shows a substantial positive correlation between the proportion of Choctaw and poverty level among single mothers in the United States with a correlation coefficient (R) of 0.509 and weighted average of 36.4%. Similarly, the statistical analysis conducted on geographies consisting of 118,210,366 people shows a weak negative correlation between the proportion of Immigrants from Sudan and poverty level among single mothers in the United States with a correlation coefficient (R) of -0.208 and weighted average of 30.1%, a difference of 21.0%.
Single Mother Poverty Correlation Summary
| Measurement | Choctaw | Immigrants from Sudan |
| Minimum | 24.0% | 4.5% |
| Maximum | 100.0% | 75.1% |
| Range | 76.0% | 70.6% |
| Mean | 53.6% | 30.8% |
| Median | 51.8% | 29.7% |
| Interquartile 25% (IQ1) | 42.5% | 24.1% |
| Interquartile 75% (IQ3) | 58.6% | 35.2% |
| Interquartile Range (IQR) | 16.1% | 11.1% |
| Standard Deviation (Sample) | 17.1% | 14.0% |
| Standard Deviation (Population) | 17.0% | 13.9% |
Similar Demographics by Single Mother Poverty
Demographics Similar to Choctaw by Single Mother Poverty
In terms of single mother poverty, the demographic groups most similar to Choctaw are Yakama (36.4%, a difference of 0.060%), Apache (36.6%, a difference of 0.48%), Native/Alaskan (36.6%, a difference of 0.58%), Creek (36.7%, a difference of 0.74%), and Dutch West Indian (36.8%, a difference of 0.98%).
| Demographics | Rating | Rank | Single Mother Poverty |
| Paiute | 0.0 /100 | #321 | Tragic 35.1% |
| Blacks/African Americans | 0.0 /100 | #322 | Tragic 35.2% |
| Kiowa | 0.0 /100 | #323 | Tragic 35.5% |
| Ottawa | 0.0 /100 | #324 | Tragic 35.5% |
| Ute | 0.0 /100 | #325 | Tragic 35.7% |
| Seminole | 0.0 /100 | #326 | Tragic 35.8% |
| Yakama | 0.0 /100 | #327 | Tragic 36.4% |
| Choctaw | 0.0 /100 | #328 | Tragic 36.4% |
| Apache | 0.0 /100 | #329 | Tragic 36.6% |
| Natives/Alaskans | 0.0 /100 | #330 | Tragic 36.6% |
| Creek | 0.0 /100 | #331 | Tragic 36.7% |
| Dutch West Indians | 0.0 /100 | #332 | Tragic 36.8% |
| Menominee | 0.0 /100 | #333 | Tragic 37.1% |
| Pueblo | 0.0 /100 | #334 | Tragic 37.2% |
| Yuman | 0.0 /100 | #335 | Tragic 37.8% |
Demographics Similar to Immigrants from Sudan by Single Mother Poverty
In terms of single mother poverty, the demographic groups most similar to Immigrants from Sudan are Spanish (30.1%, a difference of 0.030%), Immigrants from Cuba (30.1%, a difference of 0.070%), Scottish (30.1%, a difference of 0.090%), Immigrants from Liberia (30.1%, a difference of 0.12%), and Sudanese (30.0%, a difference of 0.20%).
| Demographics | Rating | Rank | Single Mother Poverty |
| Immigrants | Ghana | 11.3 /100 | #217 | Poor 29.9% |
| Hungarians | 10.3 /100 | #218 | Poor 29.9% |
| Finns | 9.3 /100 | #219 | Tragic 30.0% |
| Germans | 8.8 /100 | #220 | Tragic 30.0% |
| Immigrants | Eritrea | 7.7 /100 | #221 | Tragic 30.0% |
| Sudanese | 7.6 /100 | #222 | Tragic 30.0% |
| Immigrants | Cuba | 6.9 /100 | #223 | Tragic 30.1% |
| Immigrants | Sudan | 6.5 /100 | #224 | Tragic 30.1% |
| Spanish | 6.3 /100 | #225 | Tragic 30.1% |
| Scottish | 6.0 /100 | #226 | Tragic 30.1% |
| Immigrants | Liberia | 5.9 /100 | #227 | Tragic 30.1% |
| Spaniards | 5.4 /100 | #228 | Tragic 30.2% |
| Immigrants | Barbados | 5.0 /100 | #229 | Tragic 30.2% |
| English | 4.8 /100 | #230 | Tragic 30.2% |
| Dutch | 4.3 /100 | #231 | Tragic 30.2% |