Guyanese vs Immigrants from Belgium Poverty
COMPARE
Guyanese
Immigrants from Belgium
Poverty
Poverty Comparison
Guyanese
Immigrants from Belgium
14.5%
POVERTY
0.1/ 100
METRIC RATING
266th/ 347
METRIC RANK
11.3%
POVERTY
97.2/ 100
METRIC RATING
73rd/ 347
METRIC RANK
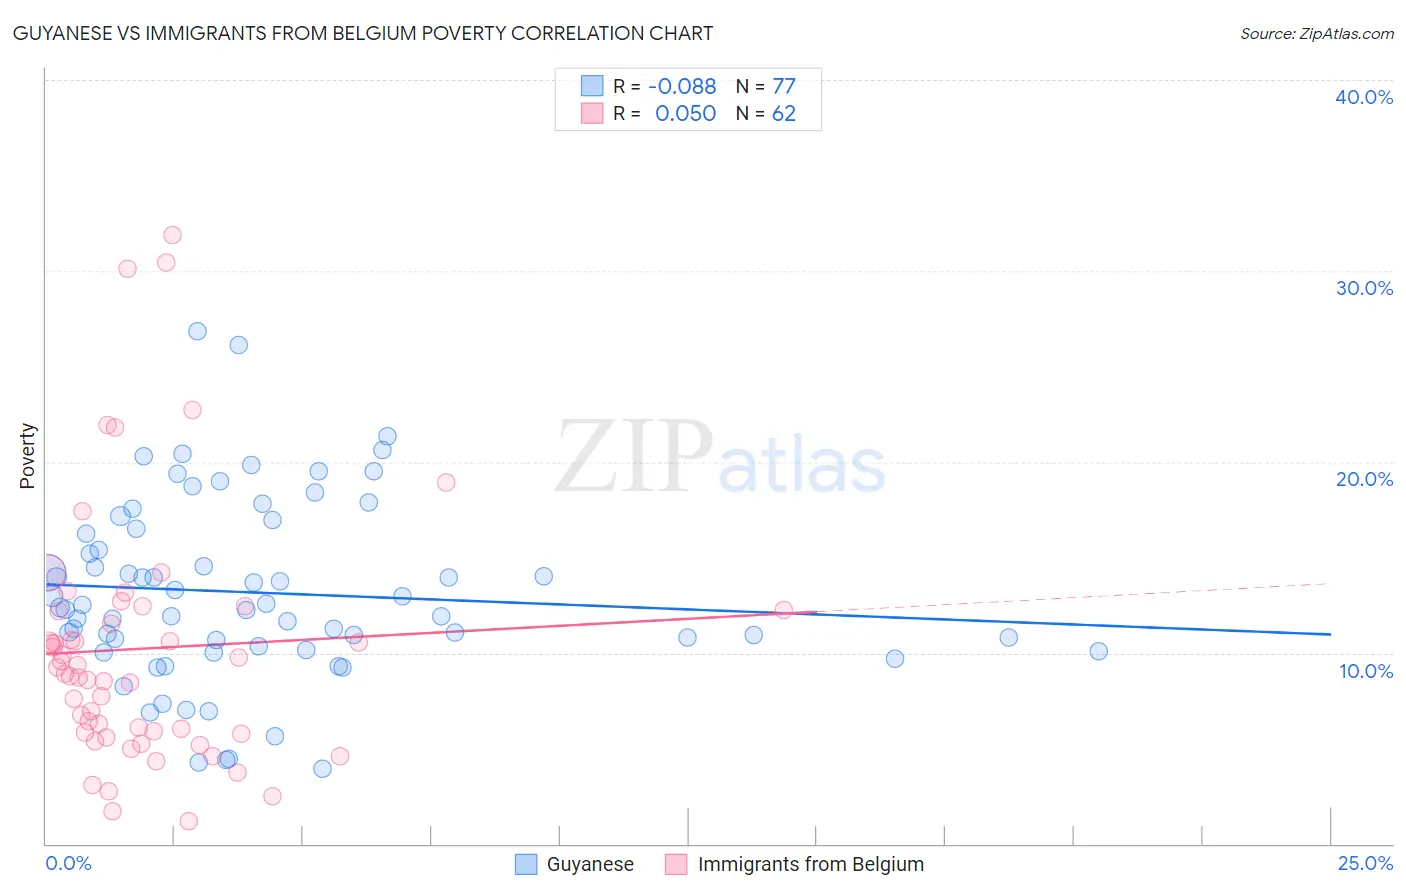
Guyanese vs Immigrants from Belgium Poverty Correlation Chart
The statistical analysis conducted on geographies consisting of 176,811,902 people shows a slight negative correlation between the proportion of Guyanese and poverty level in the United States with a correlation coefficient (R) of -0.088 and weighted average of 14.5%. Similarly, the statistical analysis conducted on geographies consisting of 146,699,020 people shows no correlation between the proportion of Immigrants from Belgium and poverty level in the United States with a correlation coefficient (R) of 0.050 and weighted average of 11.3%, a difference of 28.7%.
Poverty Correlation Summary
| Measurement | Guyanese | Immigrants from Belgium |
| Minimum | 3.9% | 1.2% |
| Maximum | 26.8% | 31.9% |
| Range | 22.9% | 30.7% |
| Mean | 13.1% | 10.2% |
| Median | 12.4% | 9.1% |
| Interquartile 25% (IQ1) | 10.2% | 5.8% |
| Interquartile 75% (IQ3) | 16.4% | 12.3% |
| Interquartile Range (IQR) | 6.2% | 6.4% |
| Standard Deviation (Sample) | 4.7% | 6.6% |
| Standard Deviation (Population) | 4.7% | 6.6% |
Similar Demographics by Poverty
Demographics Similar to Guyanese by Poverty
In terms of poverty, the demographic groups most similar to Guyanese are Immigrants from Guyana (14.5%, a difference of 0.17%), Immigrants from Jamaica (14.4%, a difference of 0.30%), Iroquois (14.5%, a difference of 0.32%), Subsaharan African (14.5%, a difference of 0.35%), and Jamaican (14.4%, a difference of 0.38%).
| Demographics | Rating | Rank | Poverty |
| Immigrants | Nicaragua | 0.1 /100 | #259 | Tragic 14.3% |
| Cape Verdeans | 0.1 /100 | #260 | Tragic 14.4% |
| Cherokee | 0.1 /100 | #261 | Tragic 14.4% |
| Immigrants | Liberia | 0.1 /100 | #262 | Tragic 14.4% |
| Jamaicans | 0.1 /100 | #263 | Tragic 14.4% |
| Immigrants | Jamaica | 0.1 /100 | #264 | Tragic 14.4% |
| Immigrants | Guyana | 0.1 /100 | #265 | Tragic 14.5% |
| Guyanese | 0.1 /100 | #266 | Tragic 14.5% |
| Iroquois | 0.1 /100 | #267 | Tragic 14.5% |
| Sub-Saharan Africans | 0.1 /100 | #268 | Tragic 14.5% |
| Immigrants | Cuba | 0.1 /100 | #269 | Tragic 14.6% |
| Central Americans | 0.1 /100 | #270 | Tragic 14.6% |
| Shoshone | 0.0 /100 | #271 | Tragic 14.7% |
| Chickasaw | 0.0 /100 | #272 | Tragic 14.7% |
| Spanish Americans | 0.0 /100 | #273 | Tragic 14.7% |
Demographics Similar to Immigrants from Belgium by Poverty
In terms of poverty, the demographic groups most similar to Immigrants from Belgium are European (11.3%, a difference of 0.0%), Zimbabwean (11.3%, a difference of 0.020%), Immigrants from Canada (11.3%, a difference of 0.040%), Carpatho Rusyn (11.3%, a difference of 0.050%), and Serbian (11.2%, a difference of 0.13%).
| Demographics | Rating | Rank | Poverty |
| Immigrants | Netherlands | 97.5 /100 | #66 | Exceptional 11.2% |
| Immigrants | Australia | 97.4 /100 | #67 | Exceptional 11.2% |
| Slovaks | 97.4 /100 | #68 | Exceptional 11.2% |
| Serbians | 97.4 /100 | #69 | Exceptional 11.2% |
| Immigrants | Canada | 97.3 /100 | #70 | Exceptional 11.3% |
| Zimbabweans | 97.3 /100 | #71 | Exceptional 11.3% |
| Europeans | 97.2 /100 | #72 | Exceptional 11.3% |
| Immigrants | Belgium | 97.2 /100 | #73 | Exceptional 11.3% |
| Carpatho Rusyns | 97.2 /100 | #74 | Exceptional 11.3% |
| Immigrants | Eastern Europe | 97.0 /100 | #75 | Exceptional 11.3% |
| Immigrants | North America | 96.8 /100 | #76 | Exceptional 11.3% |
| Immigrants | Eastern Asia | 96.7 /100 | #77 | Exceptional 11.3% |
| Dutch | 96.7 /100 | #78 | Exceptional 11.3% |
| Cambodians | 96.7 /100 | #79 | Exceptional 11.3% |
| Indians (Asian) | 96.6 /100 | #80 | Exceptional 11.3% |