Guyanese vs Immigrants from Belarus Poverty
COMPARE
Guyanese
Immigrants from Belarus
Poverty
Poverty Comparison
Guyanese
Immigrants from Belarus
14.5%
POVERTY
0.1/ 100
METRIC RATING
266th/ 347
METRIC RANK
11.6%
POVERTY
90.8/ 100
METRIC RATING
113th/ 347
METRIC RANK
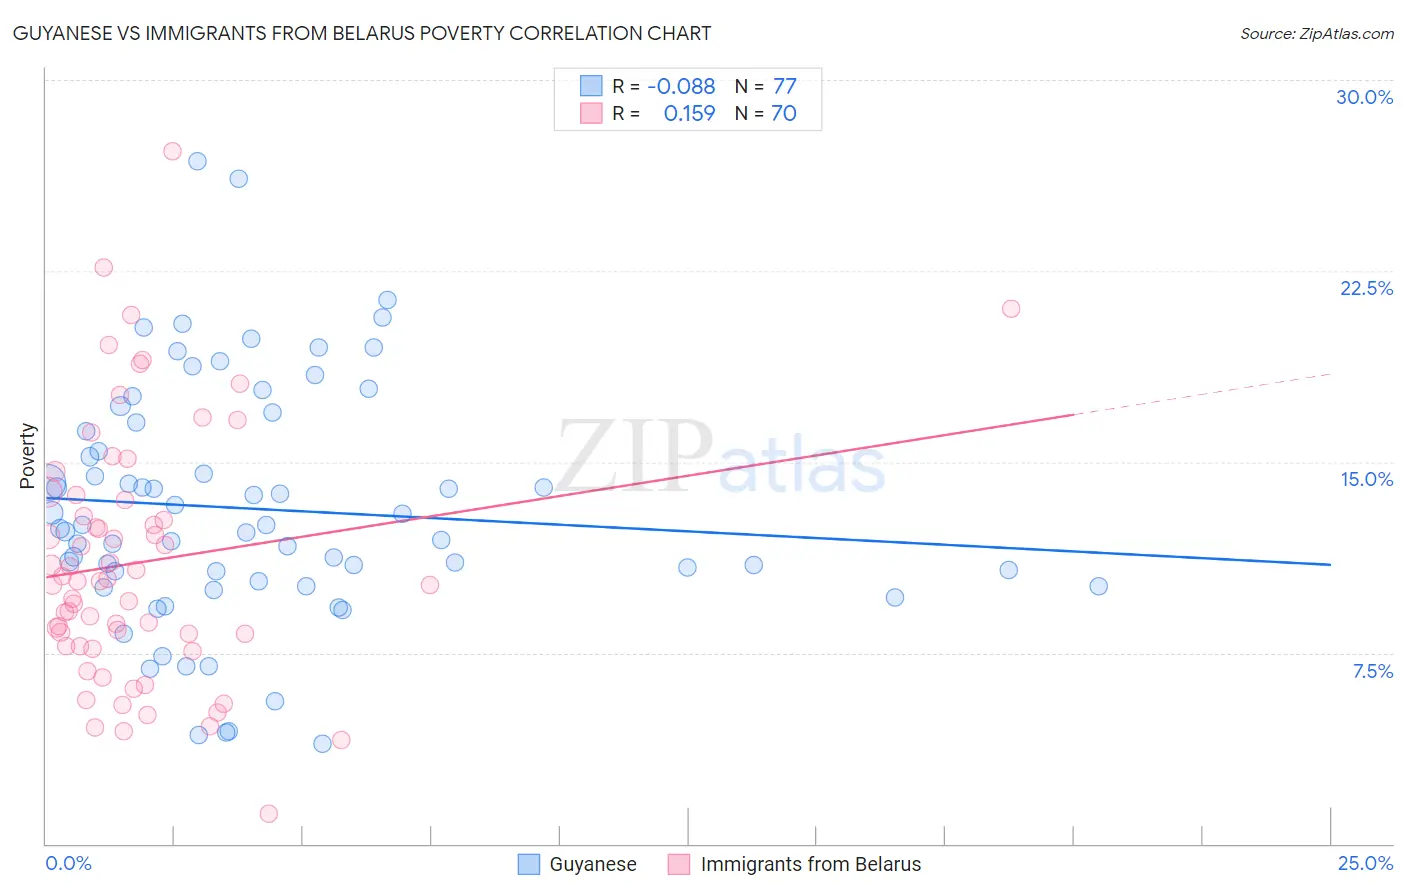
Guyanese vs Immigrants from Belarus Poverty Correlation Chart
The statistical analysis conducted on geographies consisting of 176,811,902 people shows a slight negative correlation between the proportion of Guyanese and poverty level in the United States with a correlation coefficient (R) of -0.088 and weighted average of 14.5%. Similarly, the statistical analysis conducted on geographies consisting of 150,136,945 people shows a poor positive correlation between the proportion of Immigrants from Belarus and poverty level in the United States with a correlation coefficient (R) of 0.159 and weighted average of 11.6%, a difference of 24.5%.
Poverty Correlation Summary
| Measurement | Guyanese | Immigrants from Belarus |
| Minimum | 3.9% | 1.2% |
| Maximum | 26.8% | 27.2% |
| Range | 22.9% | 26.0% |
| Mean | 13.1% | 11.1% |
| Median | 12.4% | 10.3% |
| Interquartile 25% (IQ1) | 10.2% | 7.7% |
| Interquartile 75% (IQ3) | 16.4% | 13.5% |
| Interquartile Range (IQR) | 6.2% | 5.8% |
| Standard Deviation (Sample) | 4.7% | 5.0% |
| Standard Deviation (Population) | 4.7% | 4.9% |
Similar Demographics by Poverty
Demographics Similar to Guyanese by Poverty
In terms of poverty, the demographic groups most similar to Guyanese are Immigrants from Guyana (14.5%, a difference of 0.17%), Immigrants from Jamaica (14.4%, a difference of 0.30%), Iroquois (14.5%, a difference of 0.32%), Subsaharan African (14.5%, a difference of 0.35%), and Jamaican (14.4%, a difference of 0.38%).
| Demographics | Rating | Rank | Poverty |
| Immigrants | Nicaragua | 0.1 /100 | #259 | Tragic 14.3% |
| Cape Verdeans | 0.1 /100 | #260 | Tragic 14.4% |
| Cherokee | 0.1 /100 | #261 | Tragic 14.4% |
| Immigrants | Liberia | 0.1 /100 | #262 | Tragic 14.4% |
| Jamaicans | 0.1 /100 | #263 | Tragic 14.4% |
| Immigrants | Jamaica | 0.1 /100 | #264 | Tragic 14.4% |
| Immigrants | Guyana | 0.1 /100 | #265 | Tragic 14.5% |
| Guyanese | 0.1 /100 | #266 | Tragic 14.5% |
| Iroquois | 0.1 /100 | #267 | Tragic 14.5% |
| Sub-Saharan Africans | 0.1 /100 | #268 | Tragic 14.5% |
| Immigrants | Cuba | 0.1 /100 | #269 | Tragic 14.6% |
| Central Americans | 0.1 /100 | #270 | Tragic 14.6% |
| Shoshone | 0.0 /100 | #271 | Tragic 14.7% |
| Chickasaw | 0.0 /100 | #272 | Tragic 14.7% |
| Spanish Americans | 0.0 /100 | #273 | Tragic 14.7% |
Demographics Similar to Immigrants from Belarus by Poverty
In terms of poverty, the demographic groups most similar to Immigrants from Belarus are Immigrants from Southern Europe (11.6%, a difference of 0.0%), Immigrants from China (11.6%, a difference of 0.020%), French Canadian (11.6%, a difference of 0.070%), Albanian (11.7%, a difference of 0.16%), and Welsh (11.6%, a difference of 0.24%).
| Demographics | Rating | Rank | Poverty |
| Immigrants | Zimbabwe | 92.1 /100 | #106 | Exceptional 11.6% |
| Palestinians | 91.8 /100 | #107 | Exceptional 11.6% |
| Canadians | 91.7 /100 | #108 | Exceptional 11.6% |
| Immigrants | Turkey | 91.7 /100 | #109 | Exceptional 11.6% |
| Welsh | 91.6 /100 | #110 | Exceptional 11.6% |
| French Canadians | 91.0 /100 | #111 | Exceptional 11.6% |
| Immigrants | Southern Europe | 90.8 /100 | #112 | Exceptional 11.6% |
| Immigrants | Belarus | 90.8 /100 | #113 | Exceptional 11.6% |
| Immigrants | China | 90.7 /100 | #114 | Exceptional 11.6% |
| Albanians | 90.3 /100 | #115 | Exceptional 11.7% |
| Immigrants | Russia | 89.7 /100 | #116 | Excellent 11.7% |
| Sri Lankans | 89.4 /100 | #117 | Excellent 11.7% |
| Argentineans | 89.1 /100 | #118 | Excellent 11.7% |
| Tlingit-Haida | 89.0 /100 | #119 | Excellent 11.7% |
| Immigrants | South Eastern Asia | 88.9 /100 | #120 | Excellent 11.7% |