American vs Immigrants from Belarus Poverty
COMPARE
American
Immigrants from Belarus
Poverty
Poverty Comparison
Americans
Immigrants from Belarus
13.4%
POVERTY
2.9/ 100
METRIC RATING
220th/ 347
METRIC RANK
11.6%
POVERTY
90.8/ 100
METRIC RATING
113th/ 347
METRIC RANK
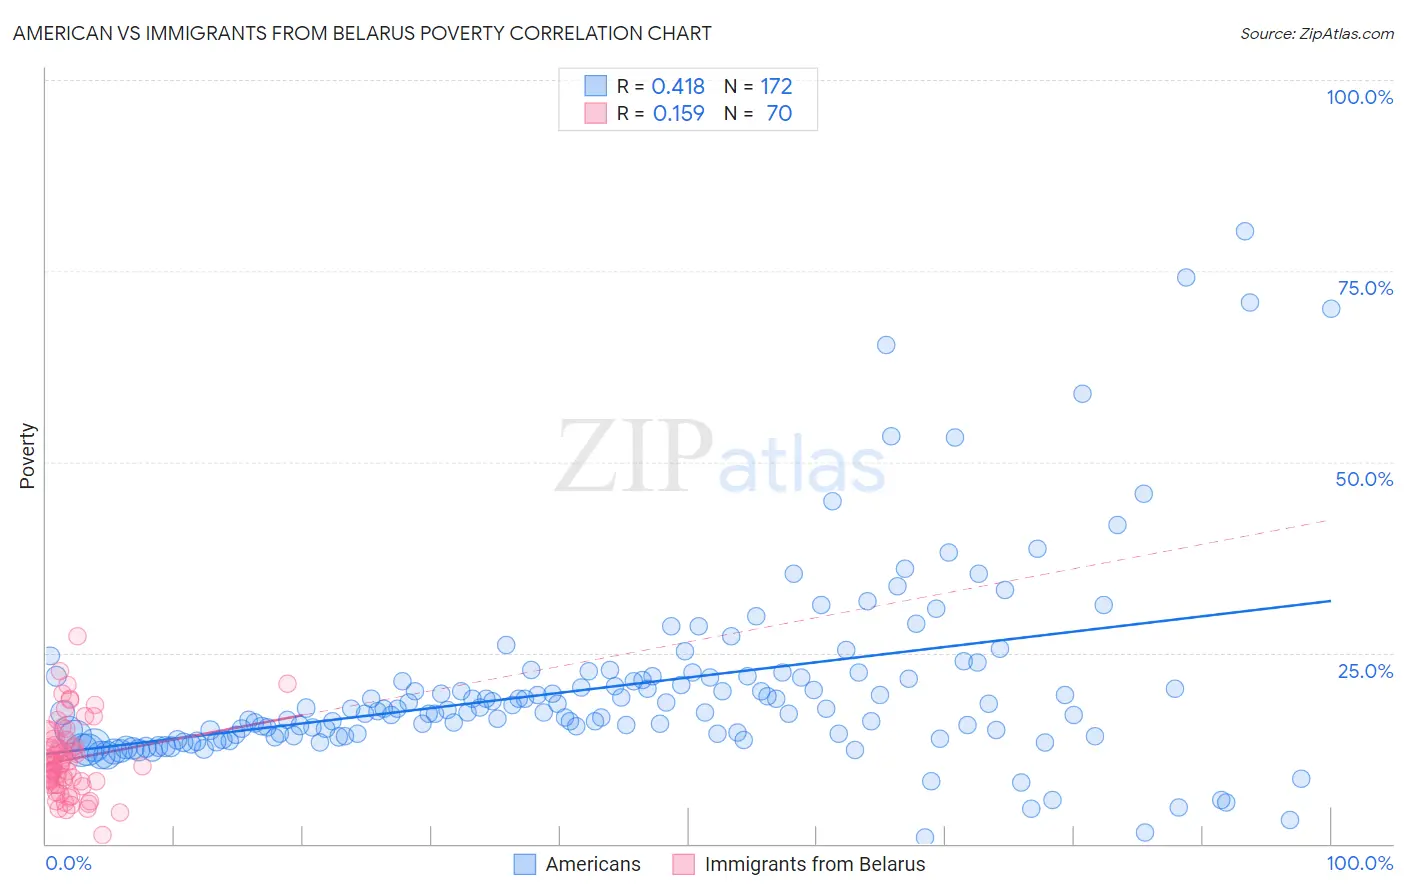
American vs Immigrants from Belarus Poverty Correlation Chart
The statistical analysis conducted on geographies consisting of 580,977,330 people shows a moderate positive correlation between the proportion of Americans and poverty level in the United States with a correlation coefficient (R) of 0.418 and weighted average of 13.4%. Similarly, the statistical analysis conducted on geographies consisting of 150,136,945 people shows a poor positive correlation between the proportion of Immigrants from Belarus and poverty level in the United States with a correlation coefficient (R) of 0.159 and weighted average of 11.6%, a difference of 14.9%.
Poverty Correlation Summary
| Measurement | American | Immigrants from Belarus |
| Minimum | 0.85% | 1.2% |
| Maximum | 80.3% | 27.2% |
| Range | 79.4% | 26.0% |
| Mean | 20.5% | 11.1% |
| Median | 17.2% | 10.3% |
| Interquartile 25% (IQ1) | 14.1% | 7.7% |
| Interquartile 75% (IQ3) | 21.9% | 13.5% |
| Interquartile Range (IQR) | 7.8% | 5.8% |
| Standard Deviation (Sample) | 12.6% | 5.0% |
| Standard Deviation (Population) | 12.5% | 4.9% |
Similar Demographics by Poverty
Demographics Similar to Americans by Poverty
In terms of poverty, the demographic groups most similar to Americans are Immigrants from Cambodia (13.4%, a difference of 0.090%), Alsatian (13.4%, a difference of 0.20%), Immigrants from Thailand (13.3%, a difference of 0.21%), Immigrants from Micronesia (13.4%, a difference of 0.24%), and Immigrants from Uzbekistan (13.3%, a difference of 0.28%).
| Demographics | Rating | Rank | Poverty |
| Immigrants | Panama | 4.1 /100 | #213 | Tragic 13.3% |
| Bermudans | 3.7 /100 | #214 | Tragic 13.3% |
| Japanese | 3.3 /100 | #215 | Tragic 13.3% |
| Immigrants | Nonimmigrants | 3.3 /100 | #216 | Tragic 13.3% |
| Immigrants | Uzbekistan | 3.2 /100 | #217 | Tragic 13.3% |
| Immigrants | Thailand | 3.1 /100 | #218 | Tragic 13.3% |
| Immigrants | Cambodia | 3.0 /100 | #219 | Tragic 13.4% |
| Americans | 2.9 /100 | #220 | Tragic 13.4% |
| Alsatians | 2.6 /100 | #221 | Tragic 13.4% |
| Immigrants | Micronesia | 2.6 /100 | #222 | Tragic 13.4% |
| Immigrants | Africa | 2.5 /100 | #223 | Tragic 13.4% |
| Immigrants | Eritrea | 2.4 /100 | #224 | Tragic 13.4% |
| German Russians | 2.2 /100 | #225 | Tragic 13.4% |
| Marshallese | 2.2 /100 | #226 | Tragic 13.4% |
| Alaska Natives | 2.1 /100 | #227 | Tragic 13.5% |
Demographics Similar to Immigrants from Belarus by Poverty
In terms of poverty, the demographic groups most similar to Immigrants from Belarus are Immigrants from Southern Europe (11.6%, a difference of 0.0%), Immigrants from China (11.6%, a difference of 0.020%), French Canadian (11.6%, a difference of 0.070%), Albanian (11.7%, a difference of 0.16%), and Welsh (11.6%, a difference of 0.24%).
| Demographics | Rating | Rank | Poverty |
| Immigrants | Zimbabwe | 92.1 /100 | #106 | Exceptional 11.6% |
| Palestinians | 91.8 /100 | #107 | Exceptional 11.6% |
| Canadians | 91.7 /100 | #108 | Exceptional 11.6% |
| Immigrants | Turkey | 91.7 /100 | #109 | Exceptional 11.6% |
| Welsh | 91.6 /100 | #110 | Exceptional 11.6% |
| French Canadians | 91.0 /100 | #111 | Exceptional 11.6% |
| Immigrants | Southern Europe | 90.8 /100 | #112 | Exceptional 11.6% |
| Immigrants | Belarus | 90.8 /100 | #113 | Exceptional 11.6% |
| Immigrants | China | 90.7 /100 | #114 | Exceptional 11.6% |
| Albanians | 90.3 /100 | #115 | Exceptional 11.7% |
| Immigrants | Russia | 89.7 /100 | #116 | Excellent 11.7% |
| Sri Lankans | 89.4 /100 | #117 | Excellent 11.7% |
| Argentineans | 89.1 /100 | #118 | Excellent 11.7% |
| Tlingit-Haida | 89.0 /100 | #119 | Excellent 11.7% |
| Immigrants | South Eastern Asia | 88.9 /100 | #120 | Excellent 11.7% |