Belizean vs Immigrants from Belarus Poverty
COMPARE
Belizean
Immigrants from Belarus
Poverty
Poverty Comparison
Belizeans
Immigrants from Belarus
14.8%
POVERTY
0.0/ 100
METRIC RATING
278th/ 347
METRIC RANK
11.6%
POVERTY
90.8/ 100
METRIC RATING
113th/ 347
METRIC RANK
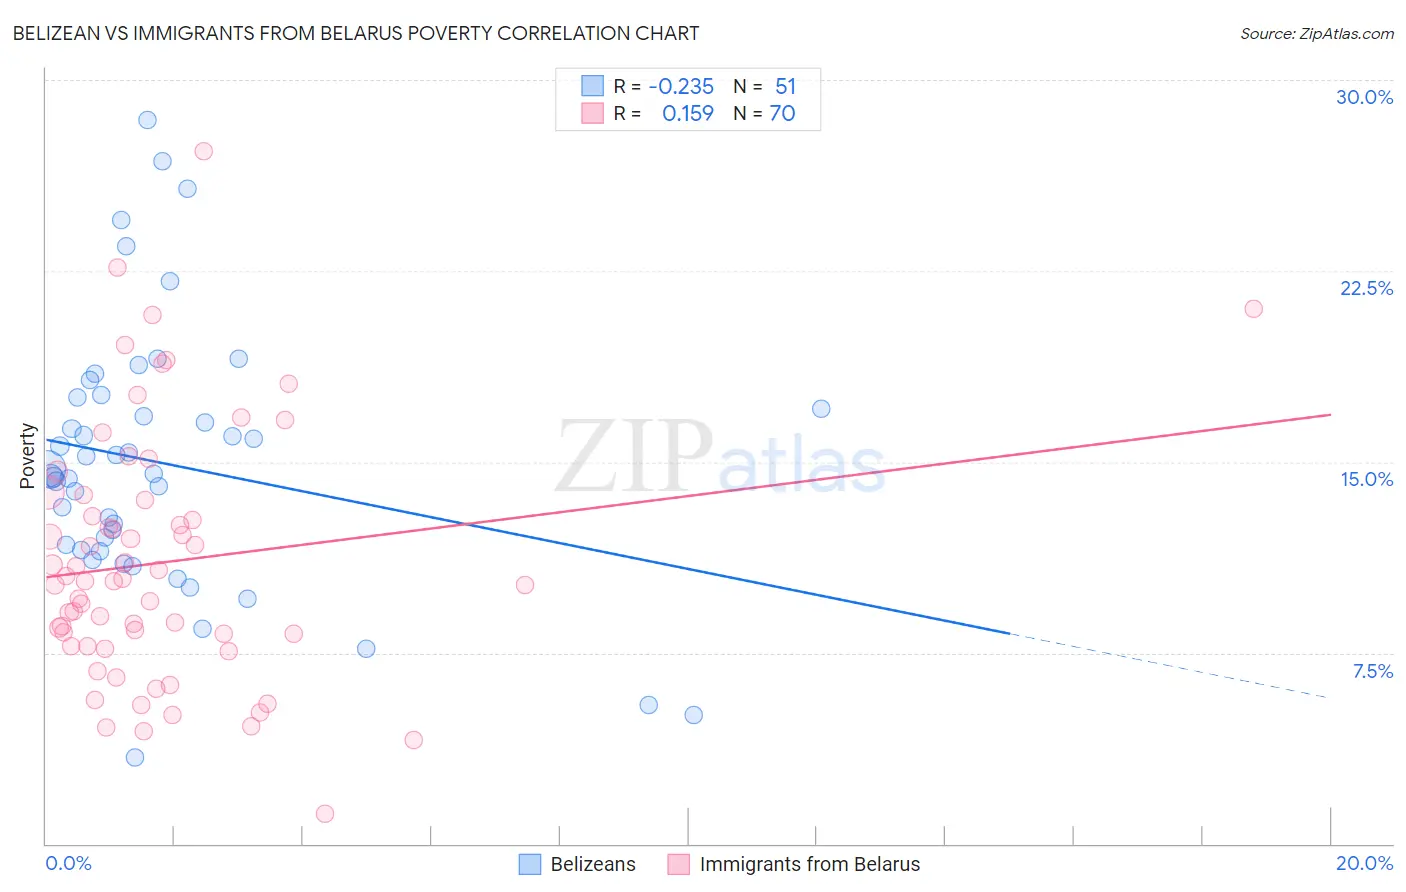
Belizean vs Immigrants from Belarus Poverty Correlation Chart
The statistical analysis conducted on geographies consisting of 144,164,069 people shows a weak negative correlation between the proportion of Belizeans and poverty level in the United States with a correlation coefficient (R) of -0.235 and weighted average of 14.8%. Similarly, the statistical analysis conducted on geographies consisting of 150,136,945 people shows a poor positive correlation between the proportion of Immigrants from Belarus and poverty level in the United States with a correlation coefficient (R) of 0.159 and weighted average of 11.6%, a difference of 27.4%.
Poverty Correlation Summary
| Measurement | Belizean | Immigrants from Belarus |
| Minimum | 3.4% | 1.2% |
| Maximum | 28.4% | 27.2% |
| Range | 25.0% | 26.0% |
| Mean | 14.9% | 11.1% |
| Median | 14.5% | 10.3% |
| Interquartile 25% (IQ1) | 11.5% | 7.7% |
| Interquartile 75% (IQ3) | 17.5% | 13.5% |
| Interquartile Range (IQR) | 6.0% | 5.8% |
| Standard Deviation (Sample) | 5.2% | 5.0% |
| Standard Deviation (Population) | 5.2% | 4.9% |
Similar Demographics by Poverty
Demographics Similar to Belizeans by Poverty
In terms of poverty, the demographic groups most similar to Belizeans are Bangladeshi (14.8%, a difference of 0.020%), Immigrants from Bahamas (14.8%, a difference of 0.070%), Immigrants from West Indies (14.8%, a difference of 0.080%), Barbadian (14.8%, a difference of 0.11%), and Immigrants from St. Vincent and the Grenadines (14.9%, a difference of 0.29%).
| Demographics | Rating | Rank | Poverty |
| Shoshone | 0.0 /100 | #271 | Tragic 14.7% |
| Chickasaw | 0.0 /100 | #272 | Tragic 14.7% |
| Spanish Americans | 0.0 /100 | #273 | Tragic 14.7% |
| Barbadians | 0.0 /100 | #274 | Tragic 14.8% |
| Immigrants | West Indies | 0.0 /100 | #275 | Tragic 14.8% |
| Immigrants | Bahamas | 0.0 /100 | #276 | Tragic 14.8% |
| Bangladeshis | 0.0 /100 | #277 | Tragic 14.8% |
| Belizeans | 0.0 /100 | #278 | Tragic 14.8% |
| Immigrants | St. Vincent and the Grenadines | 0.0 /100 | #279 | Tragic 14.9% |
| Haitians | 0.0 /100 | #280 | Tragic 14.9% |
| Immigrants | Barbados | 0.0 /100 | #281 | Tragic 14.9% |
| Comanche | 0.0 /100 | #282 | Tragic 15.0% |
| Immigrants | Haiti | 0.0 /100 | #283 | Tragic 15.0% |
| West Indians | 0.0 /100 | #284 | Tragic 15.0% |
| Vietnamese | 0.0 /100 | #285 | Tragic 15.0% |
Demographics Similar to Immigrants from Belarus by Poverty
In terms of poverty, the demographic groups most similar to Immigrants from Belarus are Immigrants from Southern Europe (11.6%, a difference of 0.0%), Immigrants from China (11.6%, a difference of 0.020%), French Canadian (11.6%, a difference of 0.070%), Albanian (11.7%, a difference of 0.16%), and Welsh (11.6%, a difference of 0.24%).
| Demographics | Rating | Rank | Poverty |
| Immigrants | Zimbabwe | 92.1 /100 | #106 | Exceptional 11.6% |
| Palestinians | 91.8 /100 | #107 | Exceptional 11.6% |
| Canadians | 91.7 /100 | #108 | Exceptional 11.6% |
| Immigrants | Turkey | 91.7 /100 | #109 | Exceptional 11.6% |
| Welsh | 91.6 /100 | #110 | Exceptional 11.6% |
| French Canadians | 91.0 /100 | #111 | Exceptional 11.6% |
| Immigrants | Southern Europe | 90.8 /100 | #112 | Exceptional 11.6% |
| Immigrants | Belarus | 90.8 /100 | #113 | Exceptional 11.6% |
| Immigrants | China | 90.7 /100 | #114 | Exceptional 11.6% |
| Albanians | 90.3 /100 | #115 | Exceptional 11.7% |
| Immigrants | Russia | 89.7 /100 | #116 | Excellent 11.7% |
| Sri Lankans | 89.4 /100 | #117 | Excellent 11.7% |
| Argentineans | 89.1 /100 | #118 | Excellent 11.7% |
| Tlingit-Haida | 89.0 /100 | #119 | Excellent 11.7% |
| Immigrants | South Eastern Asia | 88.9 /100 | #120 | Excellent 11.7% |