Yaqui vs Immigrants from Belarus Poverty
COMPARE
Yaqui
Immigrants from Belarus
Poverty
Poverty Comparison
Yaqui
Immigrants from Belarus
15.1%
POVERTY
0.0/ 100
METRIC RATING
288th/ 347
METRIC RANK
11.6%
POVERTY
90.8/ 100
METRIC RATING
113th/ 347
METRIC RANK
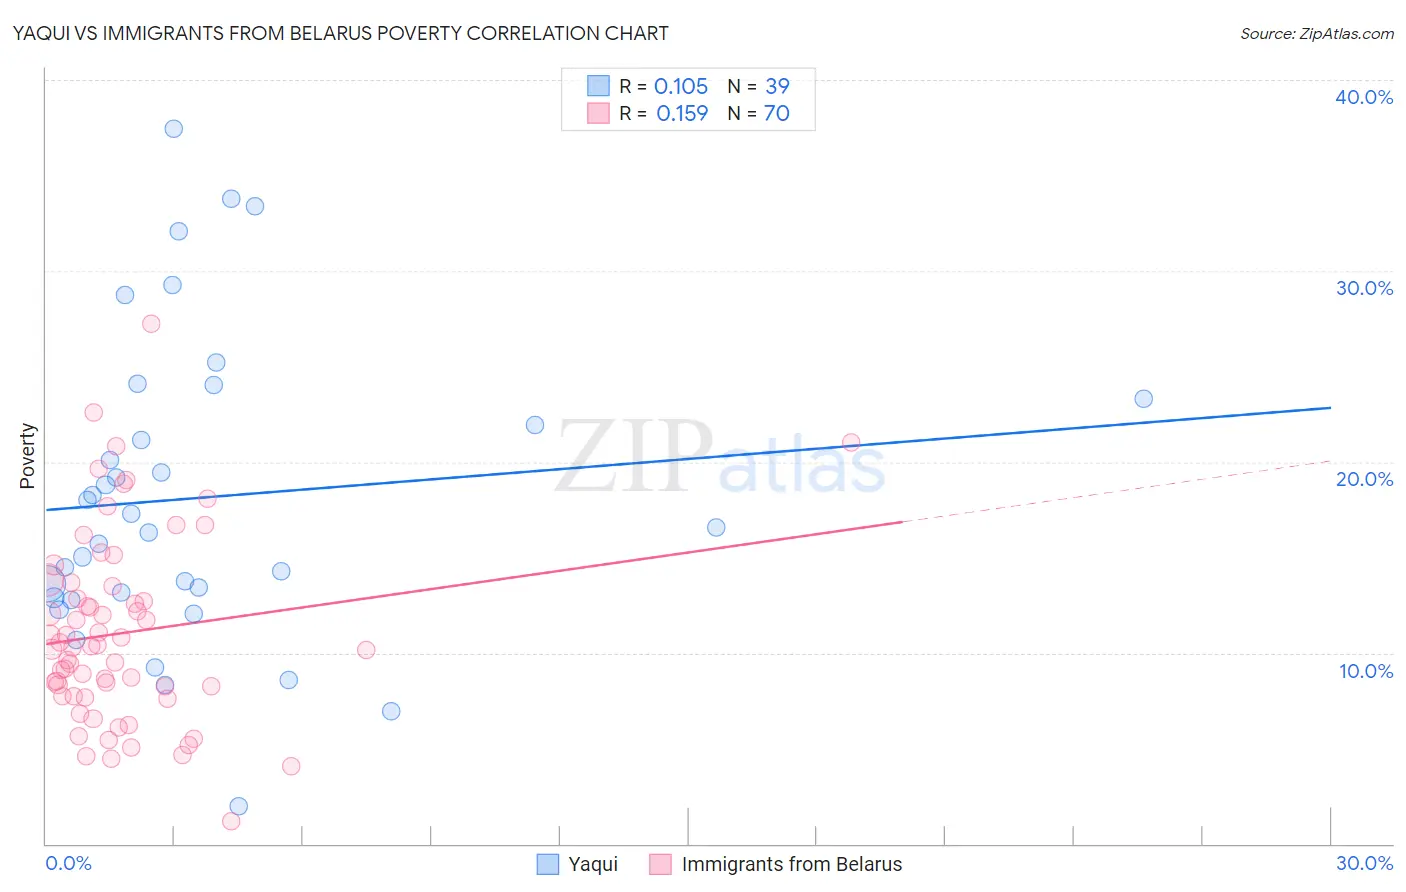
Yaqui vs Immigrants from Belarus Poverty Correlation Chart
The statistical analysis conducted on geographies consisting of 107,716,749 people shows a poor positive correlation between the proportion of Yaqui and poverty level in the United States with a correlation coefficient (R) of 0.105 and weighted average of 15.1%. Similarly, the statistical analysis conducted on geographies consisting of 150,136,945 people shows a poor positive correlation between the proportion of Immigrants from Belarus and poverty level in the United States with a correlation coefficient (R) of 0.159 and weighted average of 11.6%, a difference of 29.5%.
Poverty Correlation Summary
| Measurement | Yaqui | Immigrants from Belarus |
| Minimum | 2.0% | 1.2% |
| Maximum | 37.5% | 27.2% |
| Range | 35.5% | 26.0% |
| Mean | 18.1% | 11.1% |
| Median | 16.6% | 10.3% |
| Interquartile 25% (IQ1) | 12.9% | 7.7% |
| Interquartile 75% (IQ3) | 23.3% | 13.5% |
| Interquartile Range (IQR) | 10.4% | 5.8% |
| Standard Deviation (Sample) | 8.0% | 5.0% |
| Standard Deviation (Population) | 7.9% | 4.9% |
Similar Demographics by Poverty
Demographics Similar to Yaqui by Poverty
In terms of poverty, the demographic groups most similar to Yaqui are Inupiat (15.1%, a difference of 0.010%), Immigrants from Belize (15.1%, a difference of 0.12%), Immigrants from Latin America (15.0%, a difference of 0.22%), Mexican (15.1%, a difference of 0.22%), and Immigrants from Cabo Verde (15.1%, a difference of 0.35%).
| Demographics | Rating | Rank | Poverty |
| Immigrants | Barbados | 0.0 /100 | #281 | Tragic 14.9% |
| Comanche | 0.0 /100 | #282 | Tragic 15.0% |
| Immigrants | Haiti | 0.0 /100 | #283 | Tragic 15.0% |
| West Indians | 0.0 /100 | #284 | Tragic 15.0% |
| Vietnamese | 0.0 /100 | #285 | Tragic 15.0% |
| Immigrants | Latin America | 0.0 /100 | #286 | Tragic 15.0% |
| Inupiat | 0.0 /100 | #287 | Tragic 15.1% |
| Yaqui | 0.0 /100 | #288 | Tragic 15.1% |
| Immigrants | Belize | 0.0 /100 | #289 | Tragic 15.1% |
| Mexicans | 0.0 /100 | #290 | Tragic 15.1% |
| Immigrants | Cabo Verde | 0.0 /100 | #291 | Tragic 15.1% |
| Indonesians | 0.0 /100 | #292 | Tragic 15.1% |
| Immigrants | Zaire | 0.0 /100 | #293 | Tragic 15.1% |
| Blackfeet | 0.0 /100 | #294 | Tragic 15.2% |
| Guatemalans | 0.0 /100 | #295 | Tragic 15.3% |
Demographics Similar to Immigrants from Belarus by Poverty
In terms of poverty, the demographic groups most similar to Immigrants from Belarus are Immigrants from Southern Europe (11.6%, a difference of 0.0%), Immigrants from China (11.6%, a difference of 0.020%), French Canadian (11.6%, a difference of 0.070%), Albanian (11.7%, a difference of 0.16%), and Welsh (11.6%, a difference of 0.24%).
| Demographics | Rating | Rank | Poverty |
| Immigrants | Zimbabwe | 92.1 /100 | #106 | Exceptional 11.6% |
| Palestinians | 91.8 /100 | #107 | Exceptional 11.6% |
| Canadians | 91.7 /100 | #108 | Exceptional 11.6% |
| Immigrants | Turkey | 91.7 /100 | #109 | Exceptional 11.6% |
| Welsh | 91.6 /100 | #110 | Exceptional 11.6% |
| French Canadians | 91.0 /100 | #111 | Exceptional 11.6% |
| Immigrants | Southern Europe | 90.8 /100 | #112 | Exceptional 11.6% |
| Immigrants | Belarus | 90.8 /100 | #113 | Exceptional 11.6% |
| Immigrants | China | 90.7 /100 | #114 | Exceptional 11.6% |
| Albanians | 90.3 /100 | #115 | Exceptional 11.7% |
| Immigrants | Russia | 89.7 /100 | #116 | Excellent 11.7% |
| Sri Lankans | 89.4 /100 | #117 | Excellent 11.7% |
| Argentineans | 89.1 /100 | #118 | Excellent 11.7% |
| Tlingit-Haida | 89.0 /100 | #119 | Excellent 11.7% |
| Immigrants | South Eastern Asia | 88.9 /100 | #120 | Excellent 11.7% |