Guyanese vs Immigrants from Belarus Disability Age Over 75
COMPARE
Guyanese
Immigrants from Belarus
Disability Age Over 75
Disability Age Over 75 Comparison
Guyanese
Immigrants from Belarus
46.9%
DISABILITY AGE OVER 75
84.3/ 100
METRIC RATING
146th/ 347
METRIC RANK
47.1%
DISABILITY AGE OVER 75
74.8/ 100
METRIC RATING
154th/ 347
METRIC RANK
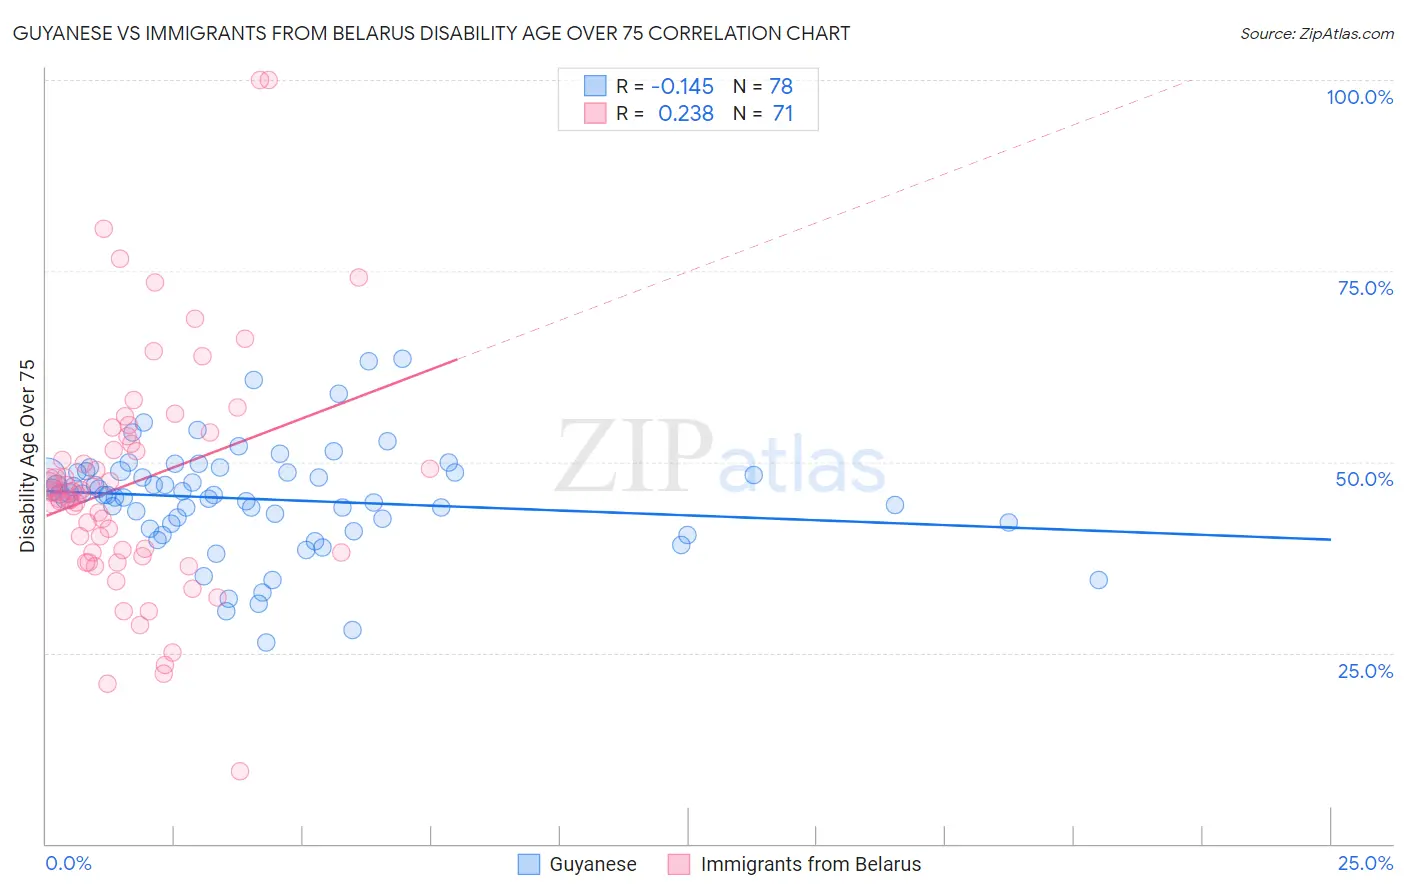
Guyanese vs Immigrants from Belarus Disability Age Over 75 Correlation Chart
The statistical analysis conducted on geographies consisting of 176,616,410 people shows a poor negative correlation between the proportion of Guyanese and percentage of population with a disability over the age of 75 in the United States with a correlation coefficient (R) of -0.145 and weighted average of 46.9%. Similarly, the statistical analysis conducted on geographies consisting of 150,140,407 people shows a weak positive correlation between the proportion of Immigrants from Belarus and percentage of population with a disability over the age of 75 in the United States with a correlation coefficient (R) of 0.238 and weighted average of 47.1%, a difference of 0.34%.
Disability Age Over 75 Correlation Summary
| Measurement | Guyanese | Immigrants from Belarus |
| Minimum | 26.4% | 9.5% |
| Maximum | 63.4% | 100.0% |
| Range | 37.1% | 90.5% |
| Mean | 45.1% | 47.2% |
| Median | 45.7% | 46.0% |
| Interquartile 25% (IQ1) | 41.8% | 38.1% |
| Interquartile 75% (IQ3) | 48.6% | 53.4% |
| Interquartile Range (IQR) | 6.8% | 15.3% |
| Standard Deviation (Sample) | 7.1% | 15.8% |
| Standard Deviation (Population) | 7.0% | 15.7% |
Demographics Similar to Guyanese and Immigrants from Belarus by Disability Age Over 75
In terms of disability age over 75, the demographic groups most similar to Guyanese are Costa Rican (46.9%, a difference of 0.010%), Immigrants from Peru (46.9%, a difference of 0.010%), Venezuelan (46.9%, a difference of 0.030%), Bermudan (46.9%, a difference of 0.060%), and Peruvian (46.8%, a difference of 0.10%). Similarly, the demographic groups most similar to Immigrants from Belarus are Immigrants from Zaire (47.1%, a difference of 0.0%), Immigrants from Iran (47.1%, a difference of 0.0%), Arab (47.1%, a difference of 0.040%), Immigrants from Asia (47.0%, a difference of 0.050%), and Bhutanese (47.1%, a difference of 0.060%).
| Demographics | Rating | Rank | Disability Age Over 75 |
| Immigrants | Costa Rica | 87.4 /100 | #140 | Excellent 46.8% |
| Lebanese | 87.0 /100 | #141 | Excellent 46.8% |
| Peruvians | 86.5 /100 | #142 | Excellent 46.8% |
| Bermudans | 85.6 /100 | #143 | Excellent 46.9% |
| Venezuelans | 85.0 /100 | #144 | Excellent 46.9% |
| Costa Ricans | 84.5 /100 | #145 | Excellent 46.9% |
| Guyanese | 84.3 /100 | #146 | Excellent 46.9% |
| Immigrants | Peru | 84.1 /100 | #147 | Excellent 46.9% |
| Asians | 81.6 /100 | #148 | Excellent 46.9% |
| Welsh | 81.3 /100 | #149 | Excellent 47.0% |
| Immigrants | Russia | 79.3 /100 | #150 | Good 47.0% |
| French Canadians | 79.0 /100 | #151 | Good 47.0% |
| Immigrants | Asia | 76.5 /100 | #152 | Good 47.0% |
| Immigrants | Zaire | 74.8 /100 | #153 | Good 47.1% |
| Immigrants | Belarus | 74.8 /100 | #154 | Good 47.1% |
| Immigrants | Iran | 74.7 /100 | #155 | Good 47.1% |
| Arabs | 73.3 /100 | #156 | Good 47.1% |
| Bhutanese | 72.6 /100 | #157 | Good 47.1% |
| Immigrants | Guyana | 71.9 /100 | #158 | Good 47.1% |
| Immigrants | Morocco | 71.4 /100 | #159 | Good 47.1% |
| Immigrants | Middle Africa | 68.3 /100 | #160 | Good 47.1% |