Greek vs Immigrants from Croatia Poverty

COMPARE

Greek
Race
Ancestry
AfghanAfricanAlaska NativeAlaskan AthabascanAlbanianAleutAlsatianAmericanApacheArabArapahoArgentineanArmenianAssyrian/Chaldean/SyriacAustralianAustrianBahamianBangladeshiBarbadianBasqueBelgianBelizeanBermudanBhutaneseBlackfeetBolivianBrazilianBritishBritish West IndianBulgarianBurmeseCajunCambodianCanadianCape VerdeanCarpatho RusynCelticCentral AmericanCentral American IndianCherokeeCheyenneChickasawChileanChineseChippewaChoctawColombianColvilleComancheCosta RicanCreeCreekCroatianCrowCubanCypriotCzechCzechoslovakianDanishDelawareDominicanDutchDutch West IndianEastern EuropeanEcuadorianEgyptianEnglishEstonianEthiopianEuropeanFijianFilipinoFinnishFrenchFrench American IndianFrench CanadianGermanGerman RussianGhanaianGreekGuamanian/ChamorroGuatemalanGuyaneseHaitianHmongHonduranHopiHoumaHungarianIcelanderIndian (Asian)IndonesianInupiatIranianIraqiIrishIroquoisIsraeliItalianJamaicanJapaneseJordanianKenyanKiowaKoreanLaotianLatvianLebaneseLiberianLithuanianLumbeeLuxembourgerMacedonianMalaysianMalteseMarshalleseMenomineeMexicanMexican American IndianMongolianMoroccanNative HawaiianNavajoNepaleseNew ZealanderNicaraguanNigerianNorthern EuropeanNorwegianOkinawanOsageOttawaPaiutePakistaniPalestinianPanamanianParaguayanPennsylvania GermanPeruvianPimaPolishPortuguesePotawatomiPuebloPuerto RicanPuget Sound SalishRomanianRussianSalvadoranSamoanScandinavianScotch-IrishScottishSeminoleSenegaleseSerbianShoshoneSierra LeoneanSiouxSlavicSlovakSloveneSomaliSouth AfricanSouth AmericanSouth American IndianSoviet UnionSpaniardSpanishSpanish AmericanSpanish American IndianSri LankanSubsaharan AfricanSudaneseSwedishSwissSyrianTaiwaneseThaiTlingit-HaidaTohono O'OdhamTonganTrinidadian and TobagonianTsimshianTurkishU.S. Virgin IslanderUgandanUkrainianUruguayanUteVenezuelanVietnameseWelshWest IndianYakamaYaquiYugoslavianYumanYup'ikZimbabwean
Immigration
NonimmigrantsImmigrantsAfghanistanAfricaAlbaniaArgentinaArmeniaAsiaAustraliaAustriaBahamasBangladeshBarbadosBelarusBelgiumBelizeBoliviaBosnia and HerzegovinaBrazilBulgariaBurma/MyanmarCabo VerdeCambodiaCameroonCanadaCaribbeanCentral AmericaChileChinaColombiaCongoCosta RicaCubaCzechoslovakiaDenmarkDominicaDominican RepublicEastern AfricaEastern AsiaEastern EuropeEcuadorEgyptEl SalvadorEnglandEritreaEthiopiaEuropeFijiFranceGermanyGhanaGreeceGrenadaGuatemalaGuyanaHaitiHondurasHong KongHungaryIndiaIndonesiaIranIraqIrelandIsraelItalyJamaicaJapanJordanKazakhstanKenyaKoreaKuwaitLaosLatin AmericaLatviaLebanonLiberiaLithuaniaMalaysiaMexicoMicronesiaMiddle AfricaMoldovaMoroccoNepalNetherlandsNicaraguaNigeriaNorth AmericaNorth MacedoniaNorthern AfricaNorthern EuropeNorwayOceaniaPakistanPanamaPeruPhilippinesPolandPortugalRomaniaRussiaSaudi ArabiaScotlandSenegalSerbiaSierra LeoneSingaporeSomaliaSouth AfricaSouth AmericaSouth Central AsiaSouth Eastern AsiaSouthern EuropeSpainSri LankaSt. Vincent and the GrenadinesSudanSwedenSwitzerlandSyriaTaiwanThailandTrinidad and TobagoTurkeyUgandaUkraineUruguayUzbekistanVenezuelaVietnamWest IndiesWestern AfricaWestern AsiaWestern EuropeYemenZaireZimbabweAzores
Immigrants from Croatia
Race
Ancestry
AfghanAfricanAlaska NativeAlaskan AthabascanAlbanianAleutAlsatianAmericanApacheArabArapahoArgentineanArmenianAssyrian/Chaldean/SyriacAustralianAustrianBahamianBangladeshiBarbadianBasqueBelgianBelizeanBermudanBhutaneseBlackfeetBolivianBrazilianBritishBritish West IndianBulgarianBurmeseCajunCambodianCanadianCape VerdeanCarpatho RusynCelticCentral AmericanCentral American IndianCherokeeCheyenneChickasawChileanChineseChippewaChoctawColombianColvilleComancheCosta RicanCreeCreekCroatianCrowCubanCypriotCzechCzechoslovakianDanishDelawareDominicanDutchDutch West IndianEastern EuropeanEcuadorianEgyptianEnglishEstonianEthiopianEuropeanFijianFilipinoFinnishFrenchFrench American IndianFrench CanadianGermanGerman RussianGhanaianGuamanian/ChamorroGuatemalanGuyaneseHaitianHmongHonduranHopiHoumaHungarianIcelanderIndian (Asian)IndonesianInupiatIranianIraqiIrishIroquoisIsraeliItalianJamaicanJapaneseJordanianKenyanKiowaKoreanLaotianLatvianLebaneseLiberianLithuanianLumbeeLuxembourgerMacedonianMalaysianMalteseMarshalleseMenomineeMexicanMexican American IndianMongolianMoroccanNative HawaiianNavajoNepaleseNew ZealanderNicaraguanNigerianNorthern EuropeanNorwegianOkinawanOsageOttawaPaiutePakistaniPalestinianPanamanianParaguayanPennsylvania GermanPeruvianPimaPolishPortuguesePotawatomiPuebloPuerto RicanPuget Sound SalishRomanianRussianSalvadoranSamoanScandinavianScotch-IrishScottishSeminoleSenegaleseSerbianShoshoneSierra LeoneanSiouxSlavicSlovakSloveneSomaliSouth AfricanSouth AmericanSouth American IndianSoviet UnionSpaniardSpanishSpanish AmericanSpanish American IndianSri LankanSubsaharan AfricanSudaneseSwedishSwissSyrianTaiwaneseThaiTlingit-HaidaTohono O'OdhamTonganTrinidadian and TobagonianTsimshianTurkishU.S. Virgin IslanderUgandanUkrainianUruguayanUteVenezuelanVietnameseWelshWest IndianYakamaYaquiYugoslavianYumanYup'ikZimbabwean
Immigration
NonimmigrantsImmigrantsAfghanistanAfricaAlbaniaArgentinaArmeniaAsiaAustraliaAustriaBahamasBangladeshBarbadosBelarusBelgiumBelizeBoliviaBosnia and HerzegovinaBrazilBulgariaBurma/MyanmarCabo VerdeCambodiaCameroonCanadaCaribbeanCentral AmericaChileChinaColombiaCongoCosta RicaCroatiaCubaCzechoslovakiaDenmarkDominicaDominican RepublicEastern AfricaEastern AsiaEastern EuropeEcuadorEgyptEl SalvadorEnglandEritreaEthiopiaEuropeFijiFranceGermanyGhanaGreeceGrenadaGuatemalaGuyanaHaitiHondurasHong KongHungaryIndiaIndonesiaIranIraqIrelandIsraelItalyJamaicaJapanJordanKazakhstanKenyaKoreaKuwaitLaosLatin AmericaLatviaLebanonLiberiaLithuaniaMalaysiaMexicoMicronesiaMiddle AfricaMoldovaMoroccoNepalNetherlandsNicaraguaNigeriaNorth AmericaNorth MacedoniaNorthern AfricaNorthern EuropeNorwayOceaniaPakistanPanamaPeruPhilippinesPolandPortugalRomaniaRussiaSaudi ArabiaScotlandSenegalSerbiaSierra LeoneSingaporeSomaliaSouth AfricaSouth AmericaSouth Central AsiaSouth Eastern AsiaSouthern EuropeSpainSri LankaSt. Vincent and the GrenadinesSudanSwedenSwitzerlandSyriaTaiwanThailandTrinidad and TobagoTurkeyUgandaUkraineUruguayUzbekistanVenezuelaVietnamWest IndiesWestern AfricaWestern AsiaWestern EuropeYemenZaireZimbabweAzores
Poverty
Income
Poverty
Unemployment
Labor Participation
Family Structure
Vehicle Availability
Education Level
Disability

Poverty Comparison

Greeks

Immigrants from Croatia

Exceptional
Exceptional
10.7%
POVERTY
99.5/ 100
METRIC RATING
29th/ 347
METRIC RANK
11.0%
POVERTY
98.7/ 100
METRIC RATING
51st/ 347
METRIC RANK

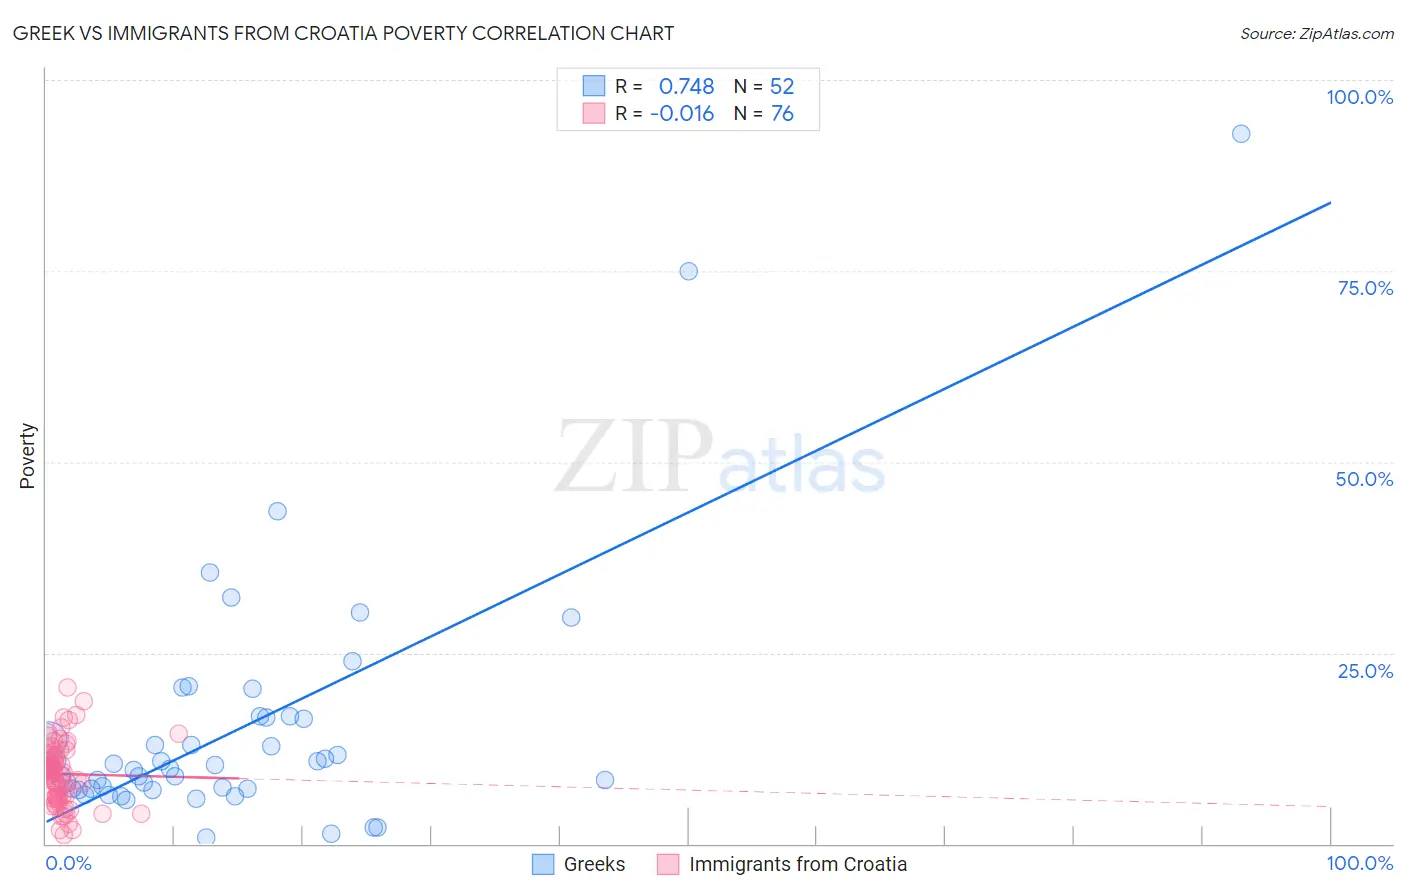
Greek vs Immigrants from Croatia Poverty Correlation Chart

The statistical analysis conducted on geographies consisting of 482,333,537 people shows a strong positive correlation between the proportion of Greeks and poverty level in the United States with a correlation coefficient (R) of 0.748 and weighted average of 10.7%. Similarly, the statistical analysis conducted on geographies consisting of 132,563,903 people shows no correlation between the proportion of Immigrants from Croatia and poverty level in the United States with a correlation coefficient (R) of -0.016 and weighted average of 11.0%, a difference of 2.8%.
Greek vs Immigrants from Croatia Poverty

Poverty Correlation Summary

MeasurementGreekImmigrants from Croatia
Minimum0.75%1.1%
Maximum93.0%20.5%
Range92.3%19.4%
Mean15.2%9.1%
Median10.1%9.4%
Interquartile 25% (IQ1)7.2%6.2%
Interquartile 75% (IQ3)16.6%11.6%
Interquartile Range (IQR)9.4%5.4%
Standard Deviation (Sample)16.5%4.0%
Standard Deviation (Population)16.4%4.0%

Similar Demographics by Poverty

Demographics Similar to Greeks by Poverty

In terms of poverty, the demographic groups most similar to Greeks are Danish (10.7%, a difference of 0.010%), Immigrants from Korea (10.7%, a difference of 0.090%), Polish (10.7%, a difference of 0.090%), Immigrants from Northern Europe (10.7%, a difference of 0.16%), and Iranian (10.7%, a difference of 0.18%).
DemographicsRating | RankPoverty
Eastern Europeans
99.7
/100
|
#22
Exceptional
10.6%
Swedes
99.7
/100
|
#23
Exceptional
10.6%
Italians
99.7
/100
|
#24
Exceptional
10.6%
Croatians
99.6
/100
|
#25
Exceptional
10.6%
Burmese
99.6
/100
|
#26
Exceptional
10.7%
Immigrants | Northern Europe
99.6
/100
|
#27
Exceptional
10.7%
Immigrants | Korea
99.5
/100
|
#28
Exceptional
10.7%
Greeks
99.5
/100
|
#29
Exceptional
10.7%
Danes
99.5
/100
|
#30
Exceptional
10.7%
Poles
99.5
/100
|
#31
Exceptional
10.7%
Iranians
99.5
/100
|
#32
Exceptional
10.7%
Macedonians
99.4
/100
|
#33
Exceptional
10.8%
Immigrants | Poland
99.4
/100
|
#34
Exceptional
10.8%
Tongans
99.4
/100
|
#35
Exceptional
10.8%
Cypriots
99.3
/100
|
#36
Exceptional
10.8%

Demographics Similar to Immigrants from Croatia by Poverty

In terms of poverty, the demographic groups most similar to Immigrants from Croatia are Immigrants from Philippines (11.0%, a difference of 0.020%), Immigrants from Austria (11.1%, a difference of 0.24%), Immigrants from Bulgaria (11.1%, a difference of 0.36%), Immigrants from Serbia (11.1%, a difference of 0.39%), and Asian (11.0%, a difference of 0.41%).
DemographicsRating | RankPoverty
Immigrants | Moldova
99.1
/100
|
#44
Exceptional
10.9%
Turks
98.9
/100
|
#45
Exceptional
11.0%
Immigrants | Czechoslovakia
98.9
/100
|
#46
Exceptional
11.0%
Immigrants | Romania
98.9
/100
|
#47
Exceptional
11.0%
Slovenes
98.9
/100
|
#48
Exceptional
11.0%
Immigrants | Japan
98.9
/100
|
#49
Exceptional
11.0%
Asians
98.9
/100
|
#50
Exceptional
11.0%
Immigrants | Croatia
98.7
/100
|
#51
Exceptional
11.0%
Immigrants | Philippines
98.7
/100
|
#52
Exceptional
11.0%
Immigrants | Austria
98.6
/100
|
#53
Exceptional
11.1%
Immigrants | Bulgaria
98.5
/100
|
#54
Exceptional
11.1%
Immigrants | Serbia
98.5
/100
|
#55
Exceptional
11.1%
Estonians
98.2
/100
|
#56
Exceptional
11.1%
Scandinavians
98.2
/100
|
#57
Exceptional
11.1%
Germans
98.1
/100
|
#58
Exceptional
11.1%