Greek vs Immigrants from Guyana 9th Grade
COMPARE
Greek
Immigrants from Guyana
9th Grade
9th Grade Comparison
Greeks
Immigrants from Guyana
96.0%
9TH GRADE
99.9/ 100
METRIC RATING
49th/ 347
METRIC RANK
92.5%
9TH GRADE
0.0/ 100
METRIC RATING
308th/ 347
METRIC RANK
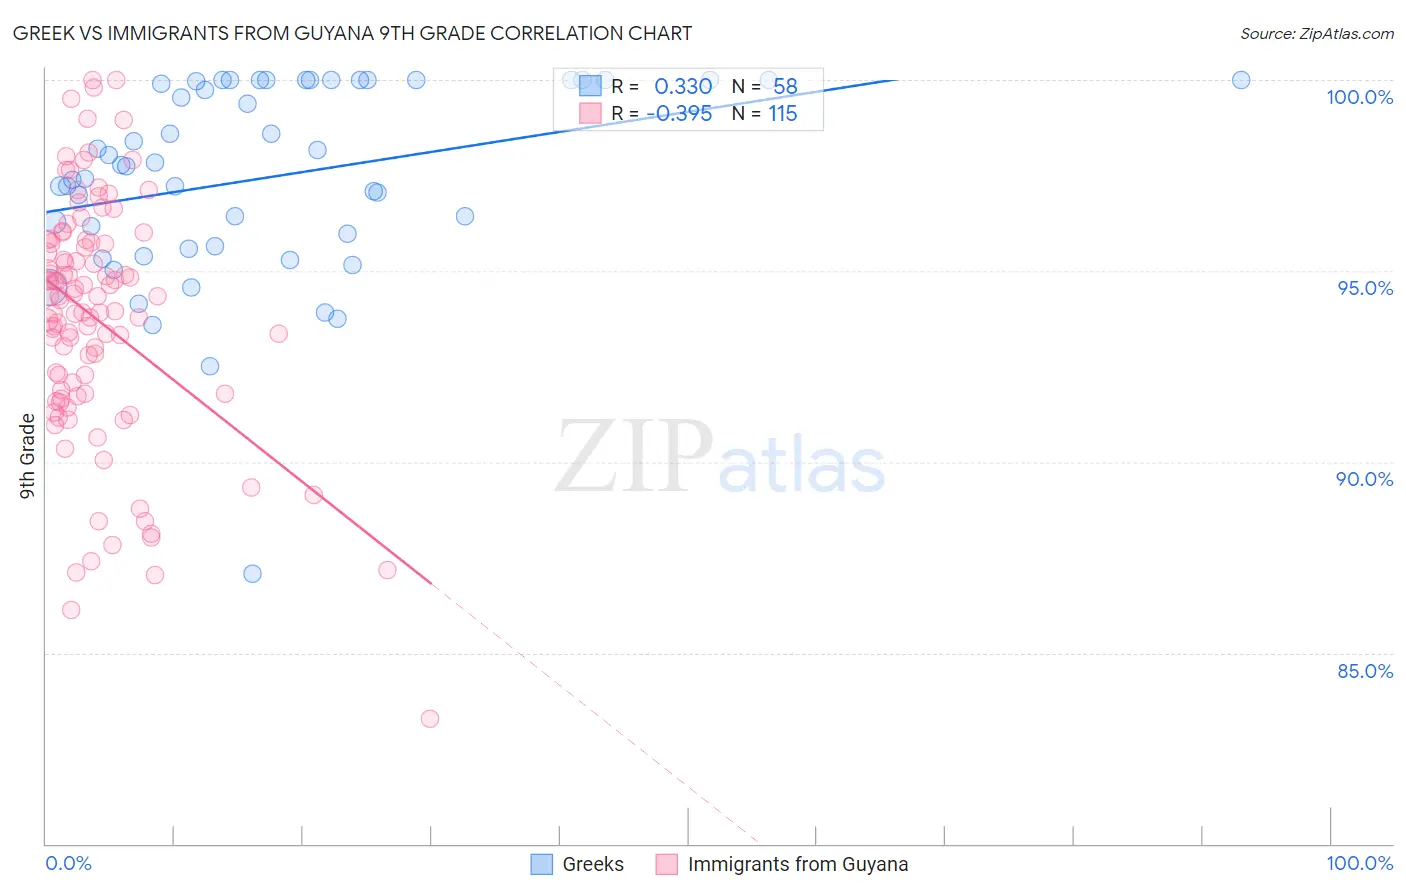
Greek vs Immigrants from Guyana 9th Grade Correlation Chart
The statistical analysis conducted on geographies consisting of 482,775,358 people shows a mild positive correlation between the proportion of Greeks and percentage of population with at least 9th grade education in the United States with a correlation coefficient (R) of 0.330 and weighted average of 96.0%. Similarly, the statistical analysis conducted on geographies consisting of 183,673,461 people shows a mild negative correlation between the proportion of Immigrants from Guyana and percentage of population with at least 9th grade education in the United States with a correlation coefficient (R) of -0.395 and weighted average of 92.5%, a difference of 3.8%.
9th Grade Correlation Summary
| Measurement | Greek | Immigrants from Guyana |
| Minimum | 87.1% | 83.3% |
| Maximum | 100.0% | 100.0% |
| Range | 12.9% | 16.7% |
| Mean | 97.5% | 93.7% |
| Median | 97.7% | 94.3% |
| Interquartile 25% (IQ1) | 95.6% | 91.8% |
| Interquartile 75% (IQ3) | 100.0% | 95.7% |
| Interquartile Range (IQR) | 4.4% | 4.0% |
| Standard Deviation (Sample) | 2.6% | 3.2% |
| Standard Deviation (Population) | 2.5% | 3.2% |
Similar Demographics by 9th Grade
Demographics Similar to Greeks by 9th Grade
In terms of 9th grade, the demographic groups most similar to Greeks are Russian (96.0%, a difference of 0.010%), Australian (96.0%, a difference of 0.010%), Celtic (96.0%, a difference of 0.010%), Crow (96.1%, a difference of 0.020%), and Immigrants from India (96.1%, a difference of 0.020%).
| Demographics | Rating | Rank | 9th Grade |
| Chippewa | 99.9 /100 | #42 | Exceptional 96.1% |
| Iranians | 99.9 /100 | #43 | Exceptional 96.1% |
| Alaska Natives | 99.9 /100 | #44 | Exceptional 96.1% |
| Crow | 99.9 /100 | #45 | Exceptional 96.1% |
| Immigrants | India | 99.9 /100 | #46 | Exceptional 96.1% |
| Russians | 99.9 /100 | #47 | Exceptional 96.0% |
| Australians | 99.9 /100 | #48 | Exceptional 96.0% |
| Greeks | 99.9 /100 | #49 | Exceptional 96.0% |
| Celtics | 99.9 /100 | #50 | Exceptional 96.0% |
| Immigrants | Northern Europe | 99.9 /100 | #51 | Exceptional 96.0% |
| Serbians | 99.9 /100 | #52 | Exceptional 96.0% |
| Austrians | 99.8 /100 | #53 | Exceptional 96.0% |
| Immigrants | Canada | 99.8 /100 | #54 | Exceptional 96.0% |
| Immigrants | Austria | 99.8 /100 | #55 | Exceptional 96.0% |
| Immigrants | North America | 99.8 /100 | #56 | Exceptional 96.0% |
Demographics Similar to Immigrants from Guyana by 9th Grade
In terms of 9th grade, the demographic groups most similar to Immigrants from Guyana are Immigrants (92.5%, a difference of 0.010%), Japanese (92.6%, a difference of 0.11%), Immigrants from Vietnam (92.6%, a difference of 0.11%), Tohono O'odham (92.6%, a difference of 0.13%), and Guyanese (92.7%, a difference of 0.15%).
| Demographics | Rating | Rank | 9th Grade |
| Immigrants | Haiti | 0.0 /100 | #301 | Tragic 92.7% |
| Immigrants | Dominica | 0.0 /100 | #302 | Tragic 92.7% |
| Guyanese | 0.0 /100 | #303 | Tragic 92.7% |
| Tohono O'odham | 0.0 /100 | #304 | Tragic 92.6% |
| Japanese | 0.0 /100 | #305 | Tragic 92.6% |
| Immigrants | Vietnam | 0.0 /100 | #306 | Tragic 92.6% |
| Immigrants | Immigrants | 0.0 /100 | #307 | Tragic 92.5% |
| Immigrants | Guyana | 0.0 /100 | #308 | Tragic 92.5% |
| Immigrants | Bangladesh | 0.0 /100 | #309 | Tragic 92.4% |
| Immigrants | Cambodia | 0.0 /100 | #310 | Tragic 92.4% |
| Immigrants | Fiji | 0.0 /100 | #311 | Tragic 92.3% |
| Houma | 0.0 /100 | #312 | Tragic 92.3% |
| Vietnamese | 0.0 /100 | #313 | Tragic 92.3% |
| Immigrants | Portugal | 0.0 /100 | #314 | Tragic 92.2% |
| Immigrants | Caribbean | 0.0 /100 | #315 | Tragic 92.2% |