Greek vs Argentinean Poverty
COMPARE
Greek
Argentinean
Poverty
Poverty Comparison
Greeks
Argentineans
10.7%
POVERTY
99.5/ 100
METRIC RATING
29th/ 347
METRIC RANK
11.7%
POVERTY
89.1/ 100
METRIC RATING
118th/ 347
METRIC RANK
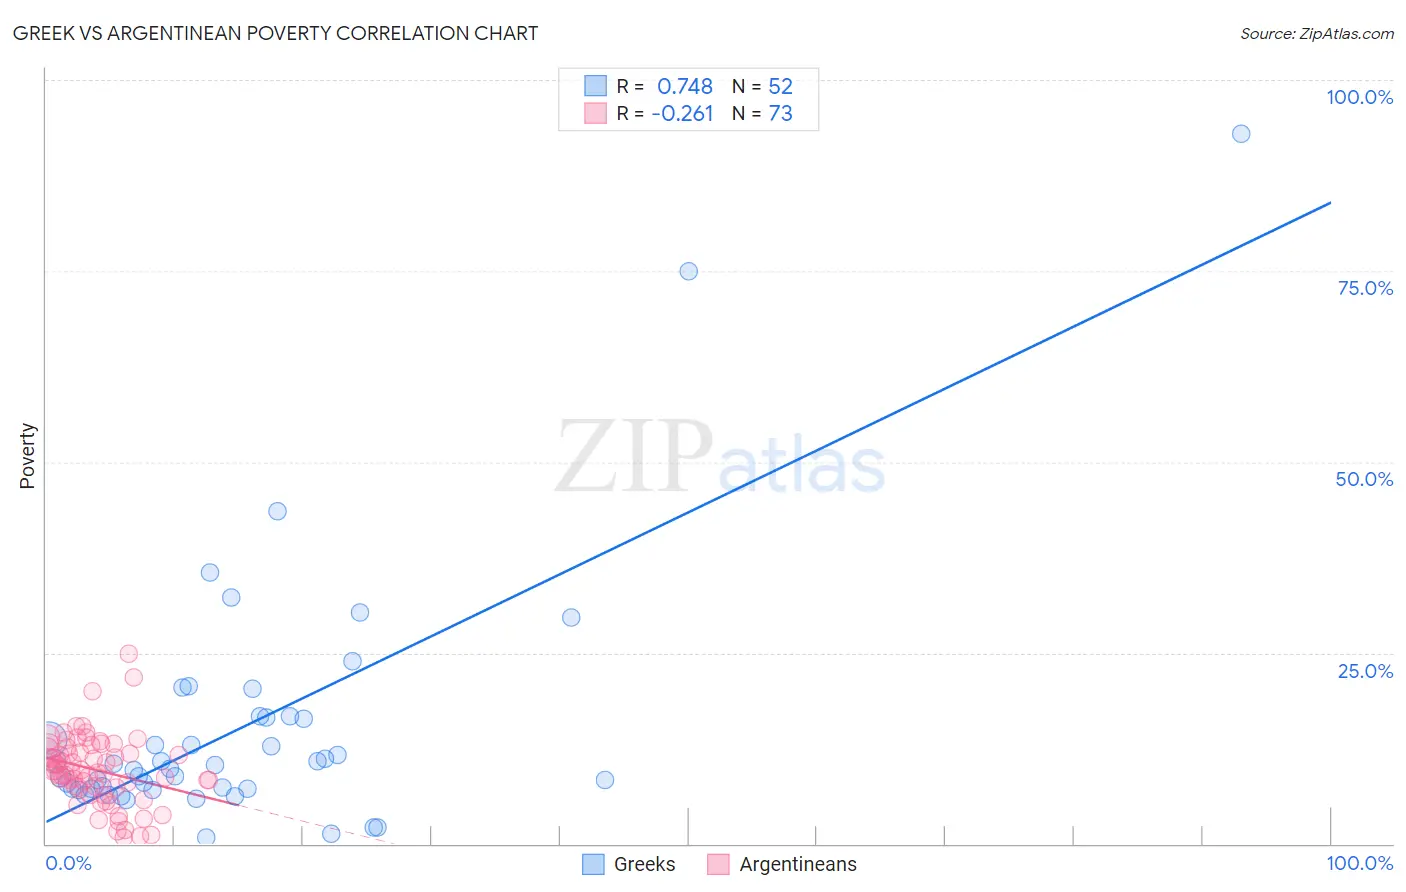
Greek vs Argentinean Poverty Correlation Chart
The statistical analysis conducted on geographies consisting of 482,333,537 people shows a strong positive correlation between the proportion of Greeks and poverty level in the United States with a correlation coefficient (R) of 0.748 and weighted average of 10.7%. Similarly, the statistical analysis conducted on geographies consisting of 296,986,445 people shows a weak negative correlation between the proportion of Argentineans and poverty level in the United States with a correlation coefficient (R) of -0.261 and weighted average of 11.7%, a difference of 9.0%.
Poverty Correlation Summary
| Measurement | Greek | Argentinean |
| Minimum | 0.75% | 0.81% |
| Maximum | 93.0% | 24.8% |
| Range | 92.3% | 24.0% |
| Mean | 15.2% | 9.7% |
| Median | 10.1% | 9.6% |
| Interquartile 25% (IQ1) | 7.2% | 7.4% |
| Interquartile 75% (IQ3) | 16.6% | 12.5% |
| Interquartile Range (IQR) | 9.4% | 5.1% |
| Standard Deviation (Sample) | 16.5% | 4.6% |
| Standard Deviation (Population) | 16.4% | 4.5% |
Similar Demographics by Poverty
Demographics Similar to Greeks by Poverty
In terms of poverty, the demographic groups most similar to Greeks are Danish (10.7%, a difference of 0.010%), Immigrants from Korea (10.7%, a difference of 0.090%), Polish (10.7%, a difference of 0.090%), Immigrants from Northern Europe (10.7%, a difference of 0.16%), and Iranian (10.7%, a difference of 0.18%).
| Demographics | Rating | Rank | Poverty |
| Eastern Europeans | 99.7 /100 | #22 | Exceptional 10.6% |
| Swedes | 99.7 /100 | #23 | Exceptional 10.6% |
| Italians | 99.7 /100 | #24 | Exceptional 10.6% |
| Croatians | 99.6 /100 | #25 | Exceptional 10.6% |
| Burmese | 99.6 /100 | #26 | Exceptional 10.7% |
| Immigrants | Northern Europe | 99.6 /100 | #27 | Exceptional 10.7% |
| Immigrants | Korea | 99.5 /100 | #28 | Exceptional 10.7% |
| Greeks | 99.5 /100 | #29 | Exceptional 10.7% |
| Danes | 99.5 /100 | #30 | Exceptional 10.7% |
| Poles | 99.5 /100 | #31 | Exceptional 10.7% |
| Iranians | 99.5 /100 | #32 | Exceptional 10.7% |
| Macedonians | 99.4 /100 | #33 | Exceptional 10.8% |
| Immigrants | Poland | 99.4 /100 | #34 | Exceptional 10.8% |
| Tongans | 99.4 /100 | #35 | Exceptional 10.8% |
| Cypriots | 99.3 /100 | #36 | Exceptional 10.8% |
Demographics Similar to Argentineans by Poverty
In terms of poverty, the demographic groups most similar to Argentineans are Tlingit-Haida (11.7%, a difference of 0.040%), Immigrants from South Eastern Asia (11.7%, a difference of 0.050%), Sri Lankan (11.7%, a difference of 0.080%), New Zealander (11.7%, a difference of 0.11%), and Puget Sound Salish (11.7%, a difference of 0.11%).
| Demographics | Rating | Rank | Poverty |
| French Canadians | 91.0 /100 | #111 | Exceptional 11.6% |
| Immigrants | Southern Europe | 90.8 /100 | #112 | Exceptional 11.6% |
| Immigrants | Belarus | 90.8 /100 | #113 | Exceptional 11.6% |
| Immigrants | China | 90.7 /100 | #114 | Exceptional 11.6% |
| Albanians | 90.3 /100 | #115 | Exceptional 11.7% |
| Immigrants | Russia | 89.7 /100 | #116 | Excellent 11.7% |
| Sri Lankans | 89.4 /100 | #117 | Excellent 11.7% |
| Argentineans | 89.1 /100 | #118 | Excellent 11.7% |
| Tlingit-Haida | 89.0 /100 | #119 | Excellent 11.7% |
| Immigrants | South Eastern Asia | 88.9 /100 | #120 | Excellent 11.7% |
| New Zealanders | 88.7 /100 | #121 | Excellent 11.7% |
| Puget Sound Salish | 88.7 /100 | #122 | Excellent 11.7% |
| Immigrants | Hungary | 88.6 /100 | #123 | Excellent 11.7% |
| Soviet Union | 88.4 /100 | #124 | Excellent 11.7% |
| Immigrants | Brazil | 88.2 /100 | #125 | Excellent 11.7% |