Ghanaian vs Scottish Child Poverty Under the Age of 16
COMPARE
Ghanaian
Scottish
Child Poverty Under the Age of 16
Child Poverty Under the Age of 16 Comparison
Ghanaians
Scottish
18.6%
CHILD POVERTY UNDER THE AGE OF 16
0.8/ 100
METRIC RATING
240th/ 347
METRIC RANK
15.0%
CHILD POVERTY UNDER THE AGE OF 16
92.3/ 100
METRIC RATING
119th/ 347
METRIC RANK
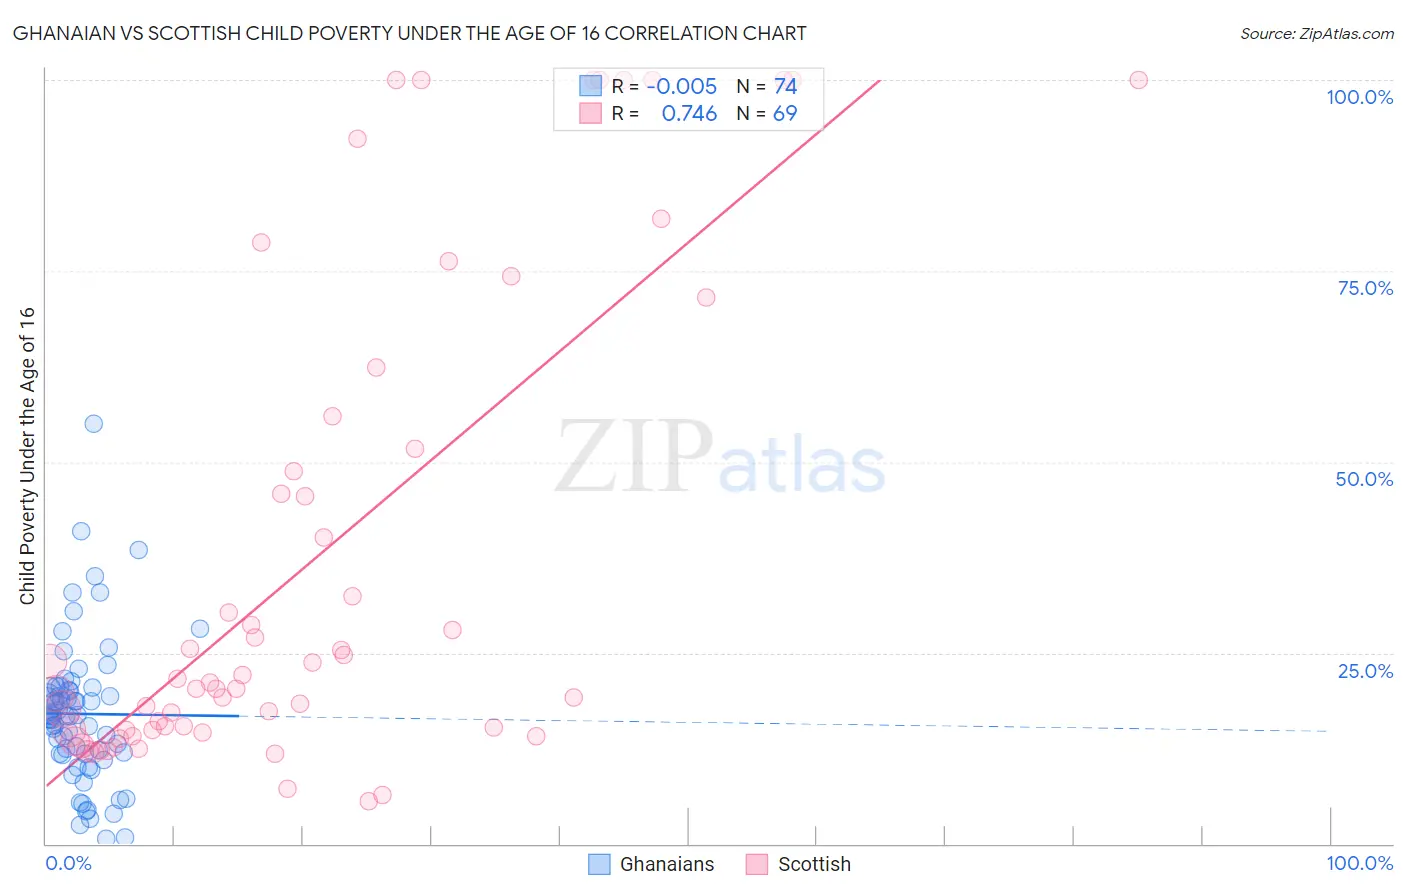
Ghanaian vs Scottish Child Poverty Under the Age of 16 Correlation Chart
The statistical analysis conducted on geographies consisting of 189,782,011 people shows no correlation between the proportion of Ghanaians and poverty level among children under the age of 16 in the United States with a correlation coefficient (R) of -0.005 and weighted average of 18.6%. Similarly, the statistical analysis conducted on geographies consisting of 554,294,508 people shows a strong positive correlation between the proportion of Scottish and poverty level among children under the age of 16 in the United States with a correlation coefficient (R) of 0.746 and weighted average of 15.0%, a difference of 23.7%.
Child Poverty Under the Age of 16 Correlation Summary
| Measurement | Ghanaian | Scottish |
| Minimum | 0.68% | 5.6% |
| Maximum | 54.9% | 100.0% |
| Range | 54.3% | 94.4% |
| Mean | 17.0% | 37.1% |
| Median | 16.7% | 21.1% |
| Interquartile 25% (IQ1) | 11.8% | 14.9% |
| Interquartile 75% (IQ3) | 20.5% | 53.8% |
| Interquartile Range (IQR) | 8.6% | 38.9% |
| Standard Deviation (Sample) | 9.5% | 31.5% |
| Standard Deviation (Population) | 9.4% | 31.2% |
Similar Demographics by Child Poverty Under the Age of 16
Demographics Similar to Ghanaians by Child Poverty Under the Age of 16
In terms of child poverty under the age of 16, the demographic groups most similar to Ghanaians are Immigrants from Sudan (18.5%, a difference of 0.050%), Immigrants from Eritrea (18.5%, a difference of 0.080%), Sudanese (18.5%, a difference of 0.33%), Cree (18.5%, a difference of 0.36%), and Alsatian (18.6%, a difference of 0.46%).
| Demographics | Rating | Rank | Child Poverty Under the Age of 16 |
| Fijians | 1.1 /100 | #233 | Tragic 18.4% |
| Immigrants | Nigeria | 1.0 /100 | #234 | Tragic 18.4% |
| Nigerians | 1.0 /100 | #235 | Tragic 18.4% |
| Cree | 0.9 /100 | #236 | Tragic 18.5% |
| Sudanese | 0.9 /100 | #237 | Tragic 18.5% |
| Immigrants | Eritrea | 0.8 /100 | #238 | Tragic 18.5% |
| Immigrants | Sudan | 0.8 /100 | #239 | Tragic 18.5% |
| Ghanaians | 0.8 /100 | #240 | Tragic 18.6% |
| Alsatians | 0.7 /100 | #241 | Tragic 18.6% |
| Immigrants | Laos | 0.6 /100 | #242 | Tragic 18.7% |
| Immigrants | Cuba | 0.6 /100 | #243 | Tragic 18.7% |
| Cape Verdeans | 0.6 /100 | #244 | Tragic 18.7% |
| Shoshone | 0.5 /100 | #245 | Tragic 18.8% |
| Immigrants | Nicaragua | 0.4 /100 | #246 | Tragic 18.8% |
| French American Indians | 0.4 /100 | #247 | Tragic 18.9% |
Demographics Similar to Scottish by Child Poverty Under the Age of 16
In terms of child poverty under the age of 16, the demographic groups most similar to Scottish are South African (15.0%, a difference of 0.090%), Immigrants from Zimbabwe (15.0%, a difference of 0.090%), Immigrants from Malaysia (15.0%, a difference of 0.15%), Immigrants from Norway (15.0%, a difference of 0.21%), and Pakistani (15.0%, a difference of 0.29%).
| Demographics | Rating | Rank | Child Poverty Under the Age of 16 |
| Irish | 93.4 /100 | #112 | Exceptional 14.9% |
| Belgians | 93.3 /100 | #113 | Exceptional 14.9% |
| Sri Lankans | 93.2 /100 | #114 | Exceptional 14.9% |
| Immigrants | Ukraine | 93.1 /100 | #115 | Exceptional 14.9% |
| Carpatho Rusyns | 93.1 /100 | #116 | Exceptional 14.9% |
| Immigrants | Norway | 92.8 /100 | #117 | Exceptional 15.0% |
| Immigrants | Malaysia | 92.6 /100 | #118 | Exceptional 15.0% |
| Scottish | 92.3 /100 | #119 | Exceptional 15.0% |
| South Africans | 92.1 /100 | #120 | Exceptional 15.0% |
| Immigrants | Zimbabwe | 92.1 /100 | #121 | Exceptional 15.0% |
| Pakistanis | 91.7 /100 | #122 | Exceptional 15.0% |
| Immigrants | Brazil | 91.1 /100 | #123 | Exceptional 15.1% |
| Czechoslovakians | 91.0 /100 | #124 | Exceptional 15.1% |
| Palestinians | 90.9 /100 | #125 | Exceptional 15.1% |
| Portuguese | 90.6 /100 | #126 | Exceptional 15.1% |