Ghanaian vs Scottish In Labor Force | Age 35-44
COMPARE
Ghanaian
Scottish
In Labor Force | Age 35-44
In Labor Force | Age 35-44 Comparison
Ghanaians
Scottish
84.8%
IN LABOR FORCE | AGE 35-44
97.2/ 100
METRIC RATING
92nd/ 347
METRIC RANK
83.9%
IN LABOR FORCE | AGE 35-44
3.2/ 100
METRIC RATING
231st/ 347
METRIC RANK
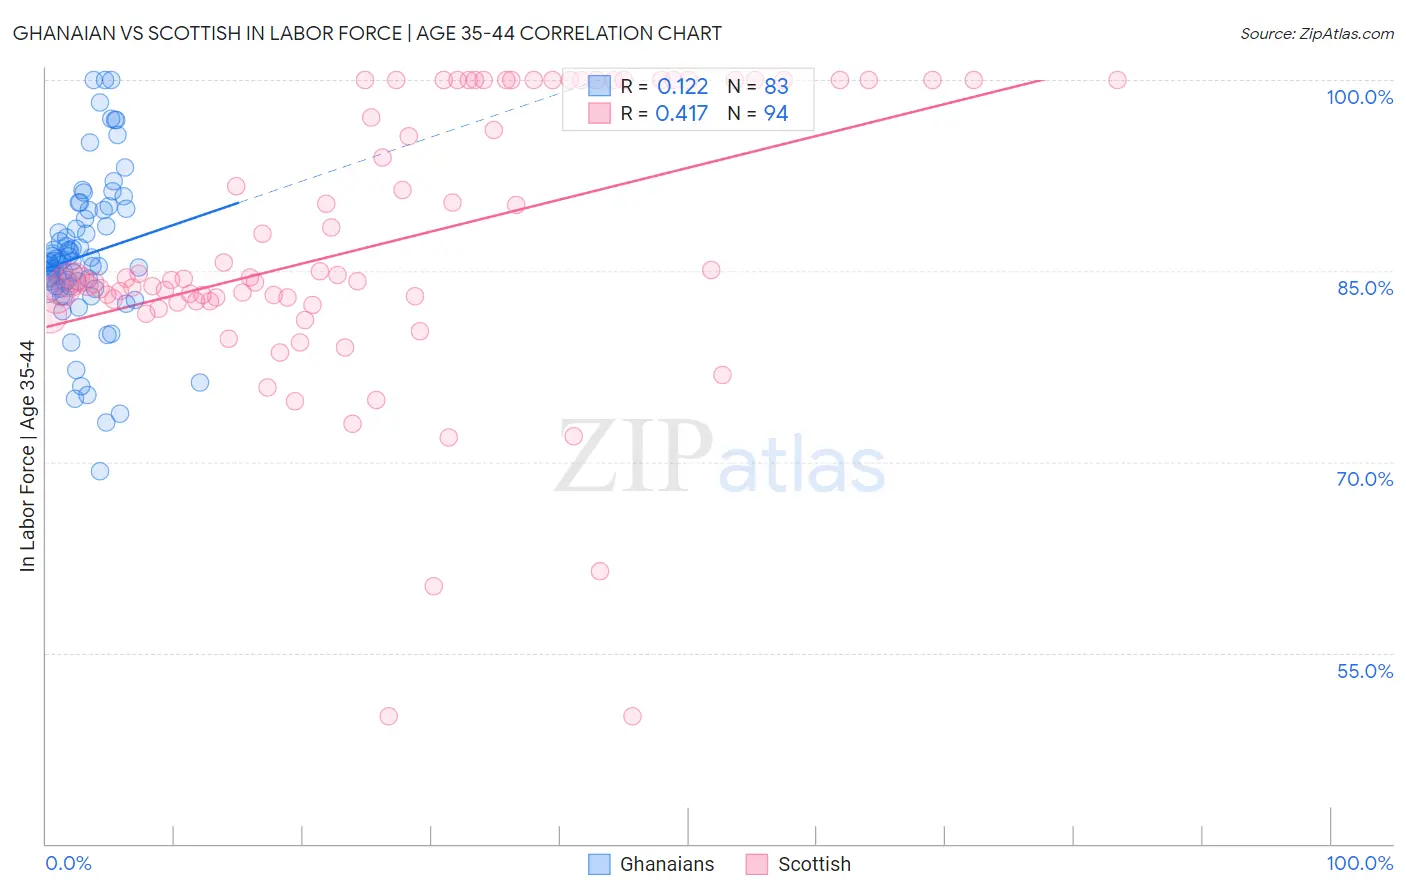
Ghanaian vs Scottish In Labor Force | Age 35-44 Correlation Chart
The statistical analysis conducted on geographies consisting of 190,561,930 people shows a poor positive correlation between the proportion of Ghanaians and labor force participation rate among population between the ages 35 and 44 in the United States with a correlation coefficient (R) of 0.122 and weighted average of 84.8%. Similarly, the statistical analysis conducted on geographies consisting of 566,464,566 people shows a moderate positive correlation between the proportion of Scottish and labor force participation rate among population between the ages 35 and 44 in the United States with a correlation coefficient (R) of 0.417 and weighted average of 83.9%, a difference of 1.1%.
In Labor Force | Age 35-44 Correlation Summary
| Measurement | Ghanaian | Scottish |
| Minimum | 69.3% | 50.0% |
| Maximum | 100.0% | 100.0% |
| Range | 30.7% | 50.0% |
| Mean | 86.2% | 87.1% |
| Median | 85.7% | 84.4% |
| Interquartile 25% (IQ1) | 83.8% | 82.6% |
| Interquartile 75% (IQ3) | 89.8% | 100.0% |
| Interquartile Range (IQR) | 6.0% | 17.4% |
| Standard Deviation (Sample) | 6.0% | 10.9% |
| Standard Deviation (Population) | 6.0% | 10.8% |
Similar Demographics by In Labor Force | Age 35-44
Demographics Similar to Ghanaians by In Labor Force | Age 35-44
In terms of in labor force | age 35-44, the demographic groups most similar to Ghanaians are Immigrants from Europe (84.9%, a difference of 0.0%), Immigrants from Northern Africa (84.8%, a difference of 0.0%), Immigrants from France (84.9%, a difference of 0.010%), Immigrants from Pakistan (84.9%, a difference of 0.020%), and Mongolian (84.8%, a difference of 0.020%).
| Demographics | Rating | Rank | In Labor Force | Age 35-44 |
| Immigrants | Middle Africa | 97.8 /100 | #85 | Exceptional 84.9% |
| Greeks | 97.8 /100 | #86 | Exceptional 84.9% |
| Belgians | 97.7 /100 | #87 | Exceptional 84.9% |
| Yugoslavians | 97.7 /100 | #88 | Exceptional 84.9% |
| Immigrants | Pakistan | 97.5 /100 | #89 | Exceptional 84.9% |
| Immigrants | France | 97.4 /100 | #90 | Exceptional 84.9% |
| Immigrants | Europe | 97.2 /100 | #91 | Exceptional 84.9% |
| Ghanaians | 97.2 /100 | #92 | Exceptional 84.8% |
| Immigrants | Northern Africa | 97.1 /100 | #93 | Exceptional 84.8% |
| Mongolians | 96.8 /100 | #94 | Exceptional 84.8% |
| Immigrants | Kuwait | 96.7 /100 | #95 | Exceptional 84.8% |
| Cubans | 96.6 /100 | #96 | Exceptional 84.8% |
| Egyptians | 96.6 /100 | #97 | Exceptional 84.8% |
| Indians (Asian) | 96.1 /100 | #98 | Exceptional 84.8% |
| Haitians | 96.0 /100 | #99 | Exceptional 84.8% |
Demographics Similar to Scottish by In Labor Force | Age 35-44
In terms of in labor force | age 35-44, the demographic groups most similar to Scottish are Native Hawaiian (83.9%, a difference of 0.010%), Immigrants from Germany (83.9%, a difference of 0.020%), Immigrants from Iraq (83.9%, a difference of 0.030%), Immigrants from Oceania (83.9%, a difference of 0.030%), and Immigrants from Syria (83.9%, a difference of 0.040%).
| Demographics | Rating | Rank | In Labor Force | Age 35-44 |
| U.S. Virgin Islanders | 6.1 /100 | #224 | Tragic 84.0% |
| Immigrants | Burma/Myanmar | 6.1 /100 | #225 | Tragic 84.0% |
| Panamanians | 5.4 /100 | #226 | Tragic 84.0% |
| British West Indians | 5.3 /100 | #227 | Tragic 84.0% |
| Welsh | 5.3 /100 | #228 | Tragic 84.0% |
| Immigrants | Thailand | 4.7 /100 | #229 | Tragic 84.0% |
| Immigrants | Iraq | 3.7 /100 | #230 | Tragic 83.9% |
| Scottish | 3.2 /100 | #231 | Tragic 83.9% |
| Native Hawaiians | 3.0 /100 | #232 | Tragic 83.9% |
| Immigrants | Germany | 2.8 /100 | #233 | Tragic 83.9% |
| Immigrants | Oceania | 2.6 /100 | #234 | Tragic 83.9% |
| Immigrants | Syria | 2.5 /100 | #235 | Tragic 83.9% |
| West Indians | 2.4 /100 | #236 | Tragic 83.9% |
| English | 1.8 /100 | #237 | Tragic 83.8% |
| Immigrants | Laos | 1.7 /100 | #238 | Tragic 83.8% |