Immigrants from Netherlands vs Northern European Child Poverty Among Girls Under 16
COMPARE
Immigrants from Netherlands
Northern European
Child Poverty Among Girls Under 16
Child Poverty Among Girls Under 16 Comparison
Immigrants from Netherlands
Northern Europeans
14.6%
CHILD POVERTY AMONG GIRLS UNDER 16
98.1/ 100
METRIC RATING
72nd/ 347
METRIC RANK
14.8%
CHILD POVERTY AMONG GIRLS UNDER 16
97.0/ 100
METRIC RATING
90th/ 347
METRIC RANK
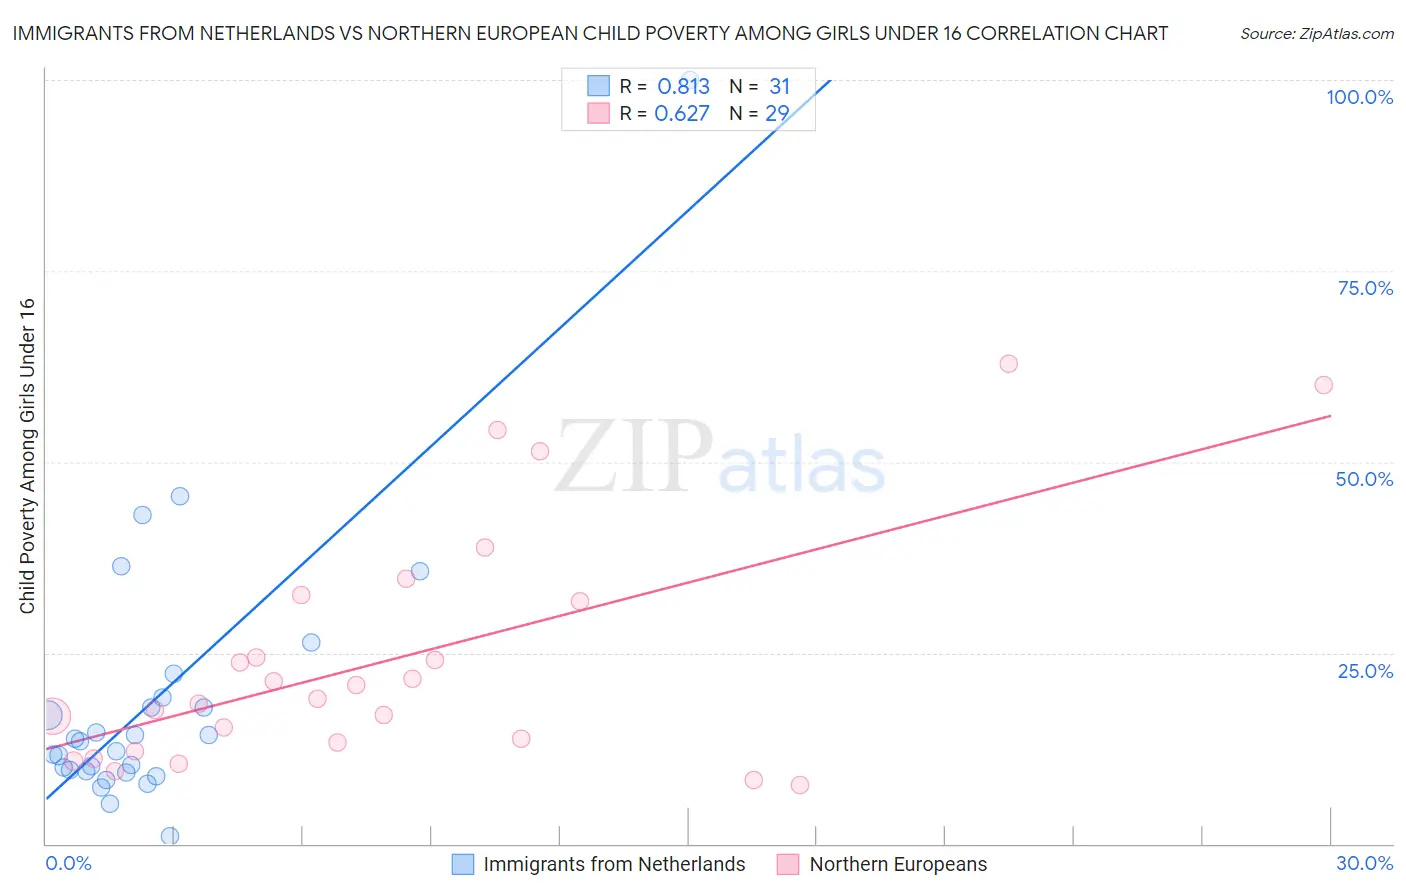
Immigrants from Netherlands vs Northern European Child Poverty Among Girls Under 16 Correlation Chart
The statistical analysis conducted on geographies consisting of 234,355,214 people shows a very strong positive correlation between the proportion of Immigrants from Netherlands and poverty level among girls under the age of 16 in the United States with a correlation coefficient (R) of 0.813 and weighted average of 14.6%. Similarly, the statistical analysis conducted on geographies consisting of 396,909,088 people shows a significant positive correlation between the proportion of Northern Europeans and poverty level among girls under the age of 16 in the United States with a correlation coefficient (R) of 0.627 and weighted average of 14.8%, a difference of 1.5%.
Child Poverty Among Girls Under 16 Correlation Summary
| Measurement | Immigrants from Netherlands | Northern European |
| Minimum | 1.0% | 7.8% |
| Maximum | 100.0% | 62.9% |
| Range | 99.0% | 55.1% |
| Mean | 18.8% | 24.2% |
| Median | 13.4% | 19.0% |
| Interquartile 25% (IQ1) | 9.5% | 12.7% |
| Interquartile 75% (IQ3) | 19.1% | 32.2% |
| Interquartile Range (IQR) | 9.6% | 19.5% |
| Standard Deviation (Sample) | 18.5% | 15.6% |
| Standard Deviation (Population) | 18.2% | 15.4% |
Demographics Similar to Immigrants from Netherlands and Northern Europeans by Child Poverty Among Girls Under 16
In terms of child poverty among girls under 16, the demographic groups most similar to Immigrants from Netherlands are Slovene (14.6%, a difference of 0.030%), Immigrants from Austria (14.6%, a difference of 0.090%), Taiwanese (14.6%, a difference of 0.12%), Immigrants from Eastern Europe (14.6%, a difference of 0.19%), and Immigrants from Russia (14.7%, a difference of 0.34%). Similarly, the demographic groups most similar to Northern Europeans are Jordanian (14.8%, a difference of 0.020%), Immigrants from Belarus (14.8%, a difference of 0.040%), Immigrants from Canada (14.8%, a difference of 0.070%), Finnish (14.8%, a difference of 0.14%), and Australian (14.8%, a difference of 0.16%).
| Demographics | Rating | Rank | Child Poverty Among Girls Under 16 |
| Slovenes | 98.1 /100 | #71 | Exceptional 14.6% |
| Immigrants | Netherlands | 98.1 /100 | #72 | Exceptional 14.6% |
| Immigrants | Austria | 98.0 /100 | #73 | Exceptional 14.6% |
| Taiwanese | 98.0 /100 | #74 | Exceptional 14.6% |
| Immigrants | Eastern Europe | 98.0 /100 | #75 | Exceptional 14.6% |
| Immigrants | Russia | 97.9 /100 | #76 | Exceptional 14.7% |
| Tlingit-Haida | 97.9 /100 | #77 | Exceptional 14.7% |
| Argentineans | 97.9 /100 | #78 | Exceptional 14.7% |
| Immigrants | Turkey | 97.9 /100 | #79 | Exceptional 14.7% |
| Egyptians | 97.9 /100 | #80 | Exceptional 14.7% |
| Ukrainians | 97.7 /100 | #81 | Exceptional 14.7% |
| Macedonians | 97.6 /100 | #82 | Exceptional 14.7% |
| Immigrants | Italy | 97.4 /100 | #83 | Exceptional 14.8% |
| Soviet Union | 97.3 /100 | #84 | Exceptional 14.8% |
| Swiss | 97.2 /100 | #85 | Exceptional 14.8% |
| Australians | 97.2 /100 | #86 | Exceptional 14.8% |
| Finns | 97.2 /100 | #87 | Exceptional 14.8% |
| Immigrants | Canada | 97.1 /100 | #88 | Exceptional 14.8% |
| Jordanians | 97.1 /100 | #89 | Exceptional 14.8% |
| Northern Europeans | 97.0 /100 | #90 | Exceptional 14.8% |
| Immigrants | Belarus | 97.0 /100 | #91 | Exceptional 14.8% |