Romanian vs Northern European Child Poverty Among Girls Under 16
COMPARE
Romanian
Northern European
Child Poverty Among Girls Under 16
Child Poverty Among Girls Under 16 Comparison
Romanians
Northern Europeans
15.0%
CHILD POVERTY AMONG GIRLS UNDER 16
95.3/ 100
METRIC RATING
104th/ 347
METRIC RANK
14.8%
CHILD POVERTY AMONG GIRLS UNDER 16
97.0/ 100
METRIC RATING
90th/ 347
METRIC RANK
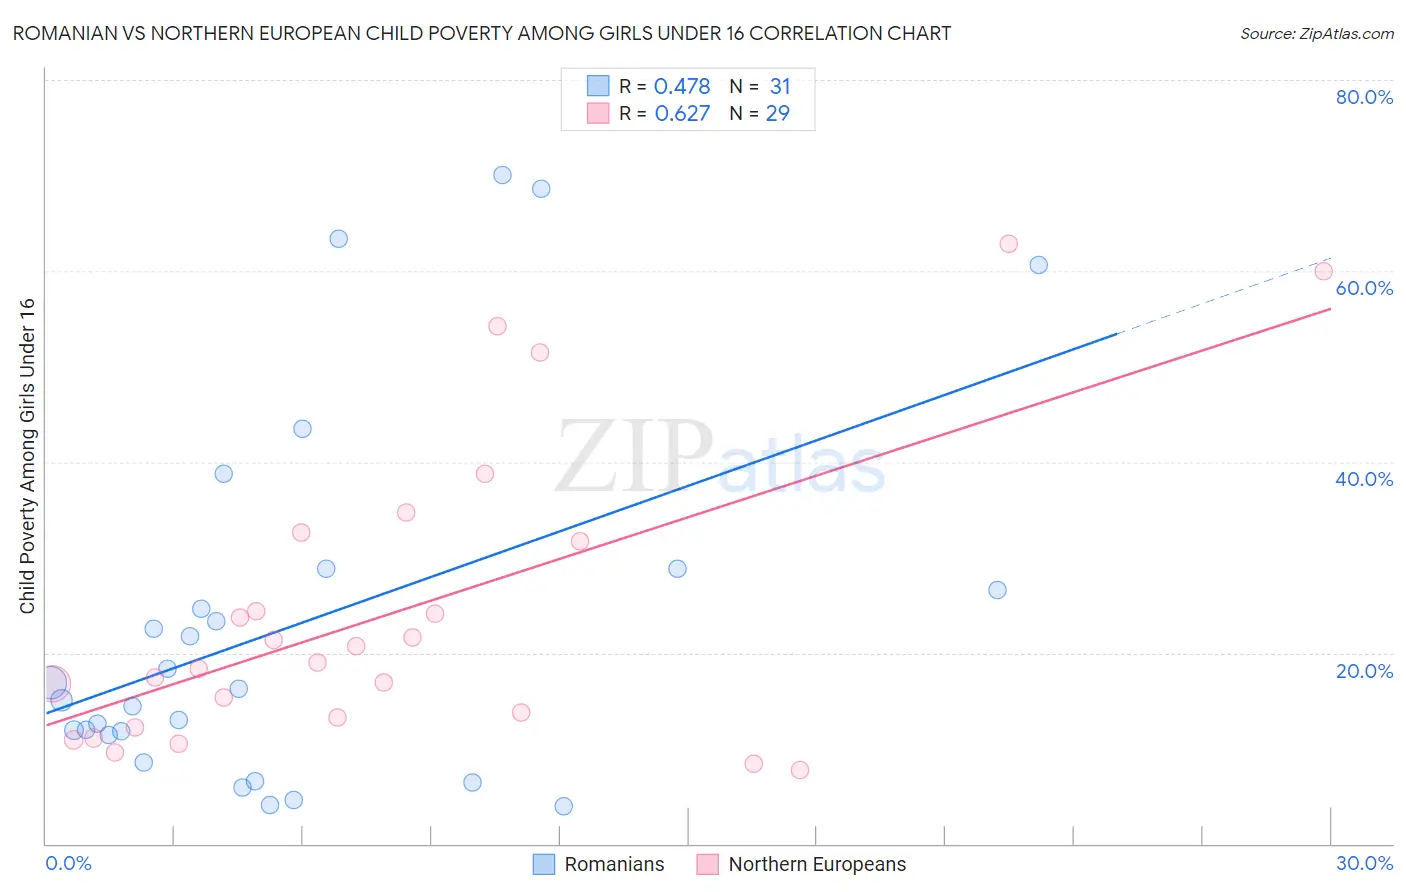
Romanian vs Northern European Child Poverty Among Girls Under 16 Correlation Chart
The statistical analysis conducted on geographies consisting of 369,938,935 people shows a moderate positive correlation between the proportion of Romanians and poverty level among girls under the age of 16 in the United States with a correlation coefficient (R) of 0.478 and weighted average of 15.0%. Similarly, the statistical analysis conducted on geographies consisting of 396,909,088 people shows a significant positive correlation between the proportion of Northern Europeans and poverty level among girls under the age of 16 in the United States with a correlation coefficient (R) of 0.627 and weighted average of 14.8%, a difference of 1.5%.
Child Poverty Among Girls Under 16 Correlation Summary
| Measurement | Romanian | Northern European |
| Minimum | 4.0% | 7.8% |
| Maximum | 70.0% | 62.9% |
| Range | 66.0% | 55.1% |
| Mean | 23.0% | 24.2% |
| Median | 16.3% | 19.0% |
| Interquartile 25% (IQ1) | 11.4% | 12.7% |
| Interquartile 75% (IQ3) | 28.8% | 32.2% |
| Interquartile Range (IQR) | 17.5% | 19.5% |
| Standard Deviation (Sample) | 19.3% | 15.6% |
| Standard Deviation (Population) | 19.0% | 15.4% |
Demographics Similar to Romanians and Northern Europeans by Child Poverty Among Girls Under 16
In terms of child poverty among girls under 16, the demographic groups most similar to Romanians are Immigrants from England (15.1%, a difference of 0.14%), Chilean (15.1%, a difference of 0.15%), British (15.0%, a difference of 0.16%), Immigrants from Malaysia (15.0%, a difference of 0.18%), and Immigrants from South Africa (15.0%, a difference of 0.19%). Similarly, the demographic groups most similar to Northern Europeans are Jordanian (14.8%, a difference of 0.020%), Immigrants from Belarus (14.8%, a difference of 0.040%), Immigrants from Canada (14.8%, a difference of 0.070%), Finnish (14.8%, a difference of 0.14%), and Austrian (14.9%, a difference of 0.39%).
| Demographics | Rating | Rank | Child Poverty Among Girls Under 16 |
| Finns | 97.2 /100 | #87 | Exceptional 14.8% |
| Immigrants | Canada | 97.1 /100 | #88 | Exceptional 14.8% |
| Jordanians | 97.1 /100 | #89 | Exceptional 14.8% |
| Northern Europeans | 97.0 /100 | #90 | Exceptional 14.8% |
| Immigrants | Belarus | 97.0 /100 | #91 | Exceptional 14.8% |
| Austrians | 96.7 /100 | #92 | Exceptional 14.9% |
| Immigrants | North America | 96.6 /100 | #93 | Exceptional 14.9% |
| Immigrants | Switzerland | 96.3 /100 | #94 | Exceptional 14.9% |
| Germans | 96.3 /100 | #95 | Exceptional 14.9% |
| Immigrants | France | 96.2 /100 | #96 | Exceptional 14.9% |
| Immigrants | Latvia | 96.1 /100 | #97 | Exceptional 14.9% |
| Basques | 95.9 /100 | #98 | Exceptional 15.0% |
| Immigrants | Egypt | 95.7 /100 | #99 | Exceptional 15.0% |
| Paraguayans | 95.7 /100 | #100 | Exceptional 15.0% |
| Immigrants | South Africa | 95.6 /100 | #101 | Exceptional 15.0% |
| Immigrants | Malaysia | 95.6 /100 | #102 | Exceptional 15.0% |
| British | 95.6 /100 | #103 | Exceptional 15.0% |
| Romanians | 95.3 /100 | #104 | Exceptional 15.0% |
| Immigrants | England | 95.1 /100 | #105 | Exceptional 15.1% |
| Chileans | 95.1 /100 | #106 | Exceptional 15.1% |
| Immigrants | Ukraine | 95.0 /100 | #107 | Exceptional 15.1% |