French vs Panamanian Child Poverty Among Girls Under 16
COMPARE
French
Panamanian
Child Poverty Among Girls Under 16
Child Poverty Among Girls Under 16 Comparison
French
Panamanians
16.0%
CHILD POVERTY AMONG GIRLS UNDER 16
72.8/ 100
METRIC RATING
160th/ 347
METRIC RANK
17.6%
CHILD POVERTY AMONG GIRLS UNDER 16
8.7/ 100
METRIC RATING
209th/ 347
METRIC RANK
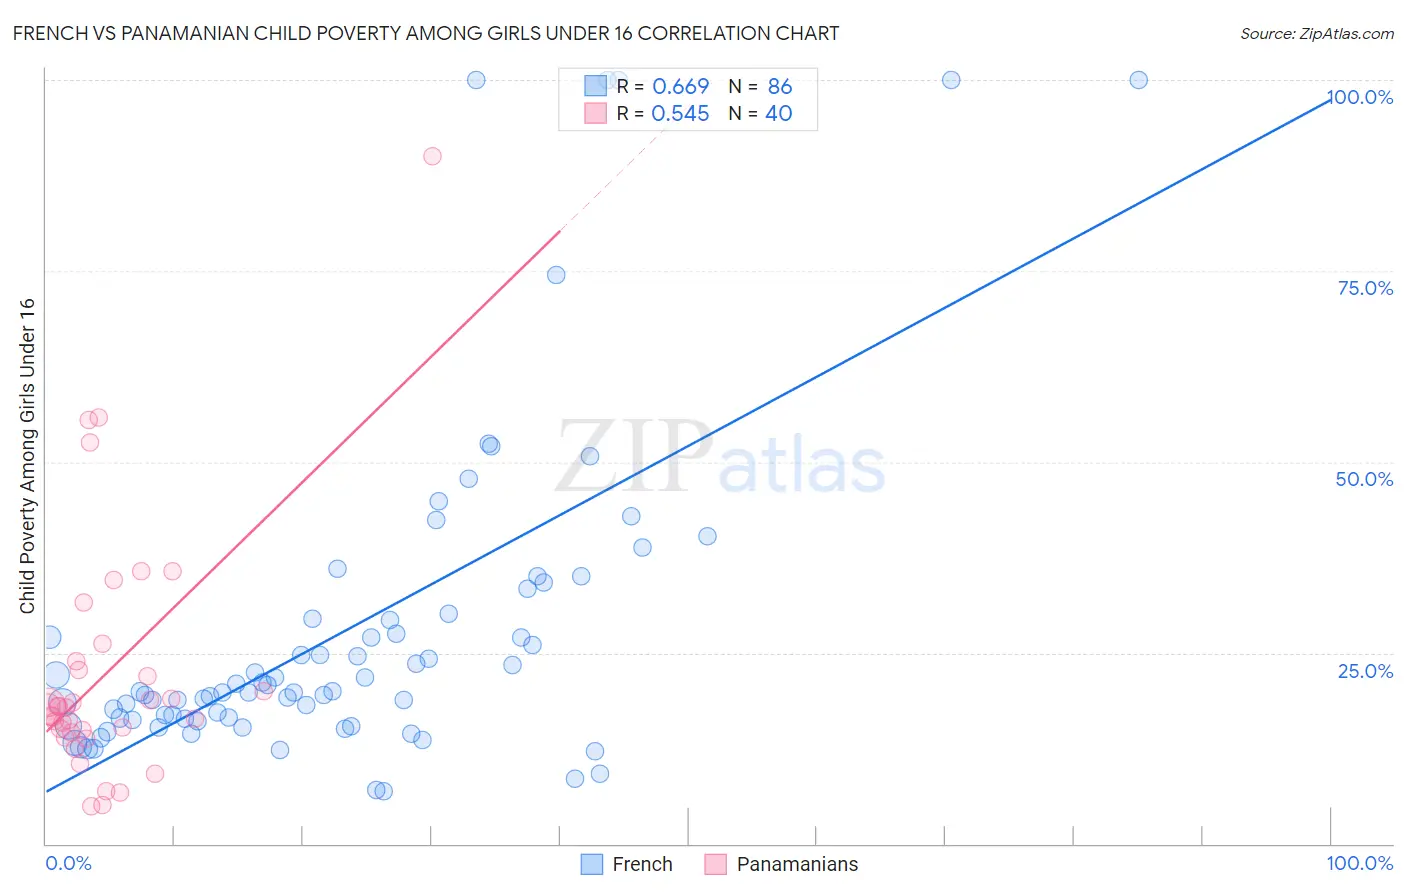
French vs Panamanian Child Poverty Among Girls Under 16 Correlation Chart
The statistical analysis conducted on geographies consisting of 549,650,331 people shows a significant positive correlation between the proportion of French and poverty level among girls under the age of 16 in the United States with a correlation coefficient (R) of 0.669 and weighted average of 16.0%. Similarly, the statistical analysis conducted on geographies consisting of 278,653,612 people shows a substantial positive correlation between the proportion of Panamanians and poverty level among girls under the age of 16 in the United States with a correlation coefficient (R) of 0.545 and weighted average of 17.6%, a difference of 9.9%.
Child Poverty Among Girls Under 16 Correlation Summary
| Measurement | French | Panamanian |
| Minimum | 6.8% | 4.8% |
| Maximum | 100.0% | 90.0% |
| Range | 93.2% | 85.2% |
| Mean | 27.8% | 22.3% |
| Median | 19.9% | 17.9% |
| Interquartile 25% (IQ1) | 16.2% | 14.7% |
| Interquartile 75% (IQ3) | 29.5% | 23.3% |
| Interquartile Range (IQR) | 13.3% | 8.7% |
| Standard Deviation (Sample) | 21.4% | 16.4% |
| Standard Deviation (Population) | 21.3% | 16.2% |
Similar Demographics by Child Poverty Among Girls Under 16
Demographics Similar to French by Child Poverty Among Girls Under 16
In terms of child poverty among girls under 16, the demographic groups most similar to French are Immigrants from Northern Africa (16.0%, a difference of 0.11%), Slovak (15.9%, a difference of 0.38%), Guamanian/Chamorro (15.9%, a difference of 0.40%), Immigrants from Fiji (15.9%, a difference of 0.52%), and Colombian (15.9%, a difference of 0.52%).
| Demographics | Rating | Rank | Child Poverty Among Girls Under 16 |
| Immigrants | Nepal | 78.5 /100 | #153 | Good 15.9% |
| Immigrants | Chile | 76.7 /100 | #154 | Good 15.9% |
| Syrians | 76.7 /100 | #155 | Good 15.9% |
| Immigrants | Fiji | 76.1 /100 | #156 | Good 15.9% |
| Colombians | 76.1 /100 | #157 | Good 15.9% |
| Guamanians/Chamorros | 75.3 /100 | #158 | Good 15.9% |
| Slovaks | 75.2 /100 | #159 | Good 15.9% |
| French | 72.8 /100 | #160 | Good 16.0% |
| Immigrants | Northern Africa | 72.0 /100 | #161 | Good 16.0% |
| French Canadians | 68.7 /100 | #162 | Good 16.1% |
| Immigrants | Oceania | 68.4 /100 | #163 | Good 16.1% |
| Immigrants | Colombia | 67.8 /100 | #164 | Good 16.1% |
| Immigrants | Germany | 67.3 /100 | #165 | Good 16.1% |
| South Americans | 67.2 /100 | #166 | Good 16.1% |
| Uruguayans | 64.7 /100 | #167 | Good 16.2% |
Demographics Similar to Panamanians by Child Poverty Among Girls Under 16
In terms of child poverty among girls under 16, the demographic groups most similar to Panamanians are Sierra Leonean (17.6%, a difference of 0.070%), Immigrants (17.7%, a difference of 0.51%), Hmong (17.5%, a difference of 0.59%), Delaware (17.4%, a difference of 0.84%), and Immigrants from Eastern Africa (17.7%, a difference of 0.90%).
| Demographics | Rating | Rank | Child Poverty Among Girls Under 16 |
| Immigrants | Sierra Leone | 17.6 /100 | #202 | Poor 17.2% |
| Ugandans | 17.5 /100 | #203 | Poor 17.2% |
| Iraqis | 13.0 /100 | #204 | Poor 17.4% |
| Immigrants | Cameroon | 12.6 /100 | #205 | Poor 17.4% |
| Delaware | 11.5 /100 | #206 | Poor 17.4% |
| Hmong | 10.6 /100 | #207 | Poor 17.5% |
| Sierra Leoneans | 8.9 /100 | #208 | Tragic 17.6% |
| Panamanians | 8.7 /100 | #209 | Tragic 17.6% |
| Immigrants | Immigrants | 7.3 /100 | #210 | Tragic 17.7% |
| Immigrants | Eastern Africa | 6.4 /100 | #211 | Tragic 17.7% |
| Immigrants | Thailand | 6.3 /100 | #212 | Tragic 17.7% |
| Pennsylvania Germans | 5.7 /100 | #213 | Tragic 17.8% |
| Malaysians | 5.7 /100 | #214 | Tragic 17.8% |
| German Russians | 5.7 /100 | #215 | Tragic 17.8% |
| Moroccans | 5.5 /100 | #216 | Tragic 17.8% |