French vs Nonimmigrants Child Poverty Among Girls Under 16
COMPARE
French
Nonimmigrants
Child Poverty Among Girls Under 16
Child Poverty Among Girls Under 16 Comparison
French
Nonimmigrants
16.0%
CHILD POVERTY AMONG GIRLS UNDER 16
72.8/ 100
METRIC RATING
160th/ 347
METRIC RANK
18.3%
CHILD POVERTY AMONG GIRLS UNDER 16
2.0/ 100
METRIC RATING
227th/ 347
METRIC RANK
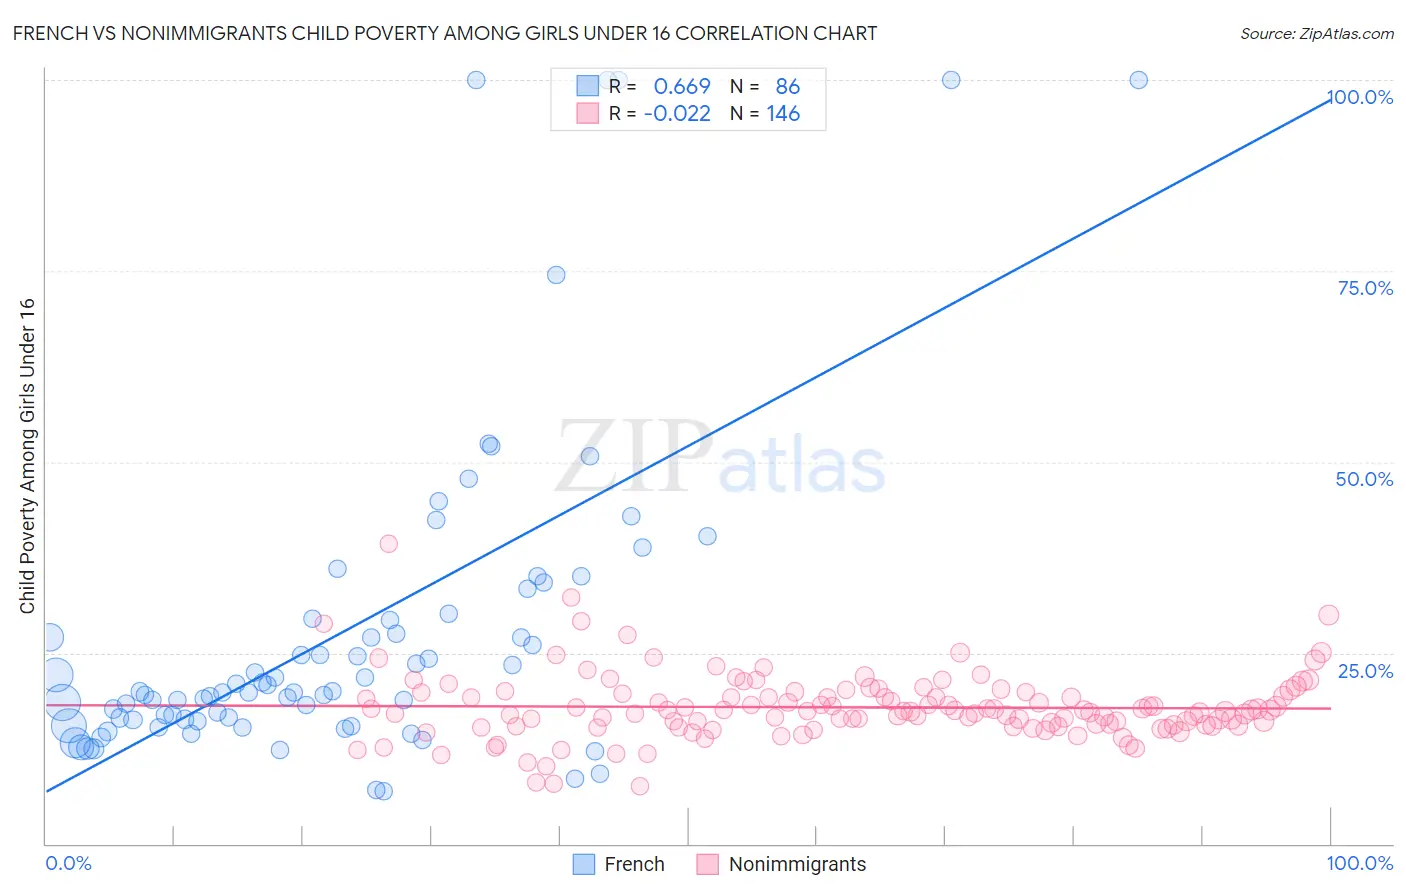
French vs Nonimmigrants Child Poverty Among Girls Under 16 Correlation Chart
The statistical analysis conducted on geographies consisting of 549,650,331 people shows a significant positive correlation between the proportion of French and poverty level among girls under the age of 16 in the United States with a correlation coefficient (R) of 0.669 and weighted average of 16.0%. Similarly, the statistical analysis conducted on geographies consisting of 559,419,552 people shows no correlation between the proportion of Nonimmigrants and poverty level among girls under the age of 16 in the United States with a correlation coefficient (R) of -0.022 and weighted average of 18.3%, a difference of 14.4%.
Child Poverty Among Girls Under 16 Correlation Summary
| Measurement | French | Nonimmigrants |
| Minimum | 6.8% | 7.6% |
| Maximum | 100.0% | 39.2% |
| Range | 93.2% | 31.6% |
| Mean | 27.8% | 17.9% |
| Median | 19.9% | 17.4% |
| Interquartile 25% (IQ1) | 16.2% | 15.5% |
| Interquartile 75% (IQ3) | 29.5% | 19.8% |
| Interquartile Range (IQR) | 13.3% | 4.3% |
| Standard Deviation (Sample) | 21.4% | 4.3% |
| Standard Deviation (Population) | 21.3% | 4.3% |
Similar Demographics by Child Poverty Among Girls Under 16
Demographics Similar to French by Child Poverty Among Girls Under 16
In terms of child poverty among girls under 16, the demographic groups most similar to French are Immigrants from Northern Africa (16.0%, a difference of 0.11%), Slovak (15.9%, a difference of 0.38%), Guamanian/Chamorro (15.9%, a difference of 0.40%), Immigrants from Fiji (15.9%, a difference of 0.52%), and Colombian (15.9%, a difference of 0.52%).
| Demographics | Rating | Rank | Child Poverty Among Girls Under 16 |
| Immigrants | Nepal | 78.5 /100 | #153 | Good 15.9% |
| Immigrants | Chile | 76.7 /100 | #154 | Good 15.9% |
| Syrians | 76.7 /100 | #155 | Good 15.9% |
| Immigrants | Fiji | 76.1 /100 | #156 | Good 15.9% |
| Colombians | 76.1 /100 | #157 | Good 15.9% |
| Guamanians/Chamorros | 75.3 /100 | #158 | Good 15.9% |
| Slovaks | 75.2 /100 | #159 | Good 15.9% |
| French | 72.8 /100 | #160 | Good 16.0% |
| Immigrants | Northern Africa | 72.0 /100 | #161 | Good 16.0% |
| French Canadians | 68.7 /100 | #162 | Good 16.1% |
| Immigrants | Oceania | 68.4 /100 | #163 | Good 16.1% |
| Immigrants | Colombia | 67.8 /100 | #164 | Good 16.1% |
| Immigrants | Germany | 67.3 /100 | #165 | Good 16.1% |
| South Americans | 67.2 /100 | #166 | Good 16.1% |
| Uruguayans | 64.7 /100 | #167 | Good 16.2% |
Demographics Similar to Nonimmigrants by Child Poverty Among Girls Under 16
In terms of child poverty among girls under 16, the demographic groups most similar to Nonimmigrants are Alaskan Athabascan (18.3%, a difference of 0.030%), Nicaraguan (18.2%, a difference of 0.51%), Immigrants from Africa (18.2%, a difference of 0.84%), Bermudan (18.1%, a difference of 0.94%), and Ghanaian (18.5%, a difference of 0.95%).
| Demographics | Rating | Rank | Child Poverty Among Girls Under 16 |
| Cubans | 4.1 /100 | #220 | Tragic 18.0% |
| Immigrants | Micronesia | 3.5 /100 | #221 | Tragic 18.0% |
| Immigrants | Cambodia | 2.9 /100 | #222 | Tragic 18.1% |
| Immigrants | Armenia | 2.9 /100 | #223 | Tragic 18.1% |
| Bermudans | 2.8 /100 | #224 | Tragic 18.1% |
| Immigrants | Africa | 2.7 /100 | #225 | Tragic 18.2% |
| Nicaraguans | 2.4 /100 | #226 | Tragic 18.2% |
| Immigrants | Nonimmigrants | 2.0 /100 | #227 | Tragic 18.3% |
| Alaskan Athabascans | 2.0 /100 | #228 | Tragic 18.3% |
| Ghanaians | 1.4 /100 | #229 | Tragic 18.5% |
| Osage | 1.3 /100 | #230 | Tragic 18.5% |
| Cree | 1.3 /100 | #231 | Tragic 18.5% |
| Immigrants | Sudan | 1.1 /100 | #232 | Tragic 18.6% |
| Sudanese | 1.1 /100 | #233 | Tragic 18.6% |
| Fijians | 1.1 /100 | #234 | Tragic 18.6% |