French Canadian vs Immigrants from Colombia Female Poverty
COMPARE
French Canadian
Immigrants from Colombia
Female Poverty
Female Poverty Comparison
French Canadians
Immigrants from Colombia
12.7%
FEMALE POVERTY
90.2/ 100
METRIC RATING
122nd/ 347
METRIC RANK
13.5%
FEMALE POVERTY
44.5/ 100
METRIC RATING
182nd/ 347
METRIC RANK
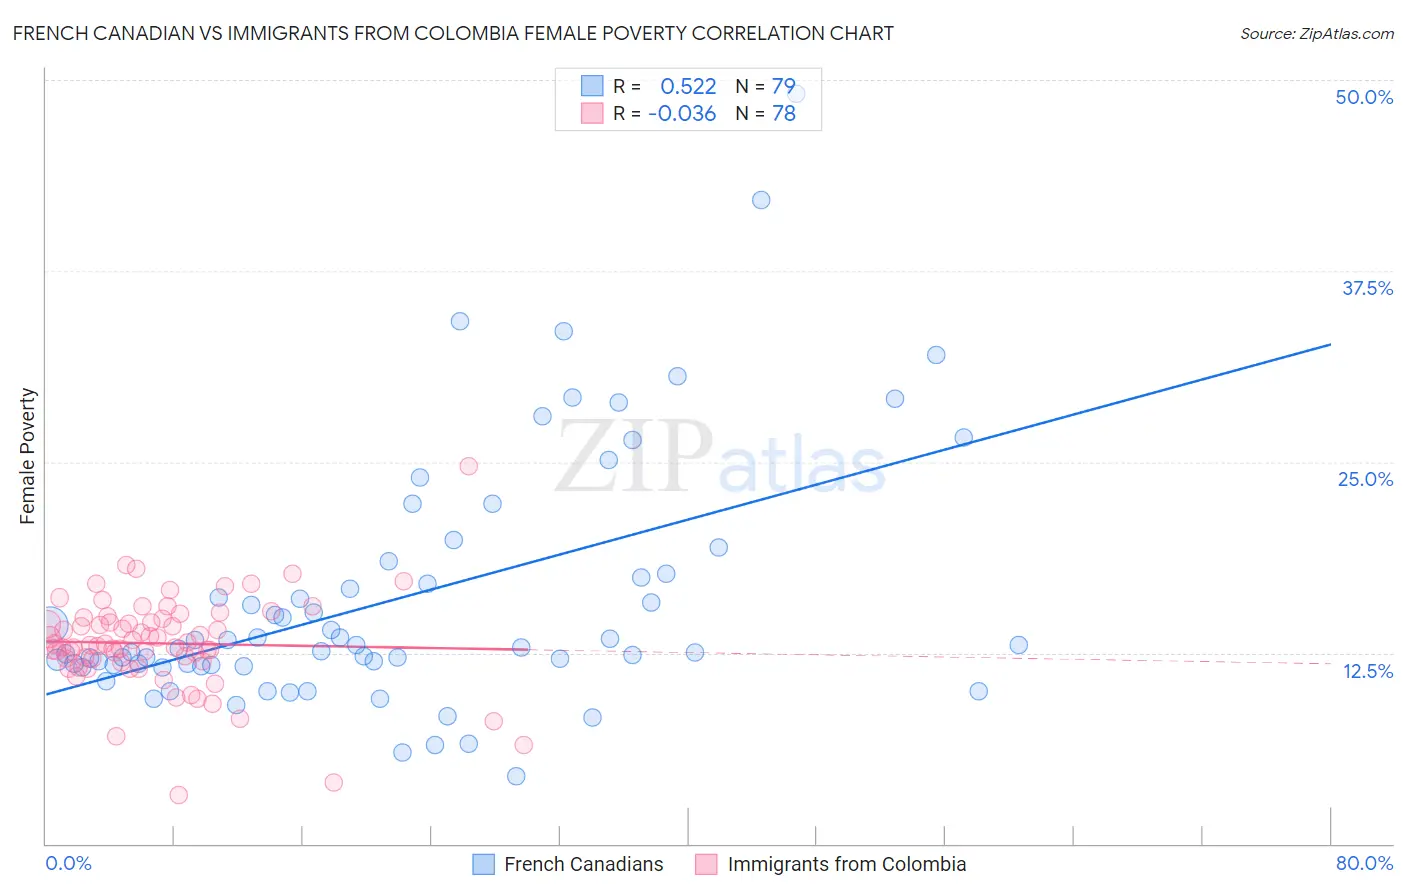
French Canadian vs Immigrants from Colombia Female Poverty Correlation Chart
The statistical analysis conducted on geographies consisting of 502,012,927 people shows a substantial positive correlation between the proportion of French Canadians and poverty level among females in the United States with a correlation coefficient (R) of 0.522 and weighted average of 12.7%. Similarly, the statistical analysis conducted on geographies consisting of 378,418,098 people shows no correlation between the proportion of Immigrants from Colombia and poverty level among females in the United States with a correlation coefficient (R) of -0.036 and weighted average of 13.5%, a difference of 6.2%.
Female Poverty Correlation Summary
| Measurement | French Canadian | Immigrants from Colombia |
| Minimum | 4.4% | 3.2% |
| Maximum | 49.1% | 24.7% |
| Range | 44.7% | 21.5% |
| Mean | 16.1% | 13.1% |
| Median | 12.8% | 13.1% |
| Interquartile 25% (IQ1) | 11.7% | 11.9% |
| Interquartile 75% (IQ3) | 17.6% | 14.7% |
| Interquartile Range (IQR) | 6.0% | 2.8% |
| Standard Deviation (Sample) | 8.3% | 3.1% |
| Standard Deviation (Population) | 8.2% | 3.1% |
Similar Demographics by Female Poverty
Demographics Similar to French Canadians by Female Poverty
In terms of female poverty, the demographic groups most similar to French Canadians are Immigrants from Hungary (12.7%, a difference of 0.040%), Immigrants from South Eastern Asia (12.7%, a difference of 0.070%), New Zealander (12.7%, a difference of 0.14%), Albanian (12.7%, a difference of 0.20%), and Sri Lankan (12.7%, a difference of 0.21%).
| Demographics | Rating | Rank | Female Poverty |
| Puget Sound Salish | 91.5 /100 | #115 | Exceptional 12.7% |
| Immigrants | Russia | 91.2 /100 | #116 | Exceptional 12.7% |
| Immigrants | Southern Europe | 90.9 /100 | #117 | Exceptional 12.7% |
| Sri Lankans | 90.9 /100 | #118 | Exceptional 12.7% |
| Albanians | 90.8 /100 | #119 | Exceptional 12.7% |
| New Zealanders | 90.6 /100 | #120 | Exceptional 12.7% |
| Immigrants | Hungary | 90.3 /100 | #121 | Exceptional 12.7% |
| French Canadians | 90.2 /100 | #122 | Exceptional 12.7% |
| Immigrants | South Eastern Asia | 89.9 /100 | #123 | Excellent 12.7% |
| Immigrants | Norway | 89.3 /100 | #124 | Excellent 12.8% |
| Argentineans | 89.1 /100 | #125 | Excellent 12.8% |
| Immigrants | Ukraine | 88.8 /100 | #126 | Excellent 12.8% |
| South Africans | 88.4 /100 | #127 | Excellent 12.8% |
| Immigrants | Belarus | 88.2 /100 | #128 | Excellent 12.8% |
| Immigrants | Brazil | 87.9 /100 | #129 | Excellent 12.8% |
Demographics Similar to Immigrants from Colombia by Female Poverty
In terms of female poverty, the demographic groups most similar to Immigrants from Colombia are Venezuelan (13.5%, a difference of 0.0%), South American (13.5%, a difference of 0.030%), Kenyan (13.5%, a difference of 0.070%), Immigrants from Sierra Leone (13.5%, a difference of 0.13%), and Immigrants from Cameroon (13.5%, a difference of 0.24%).
| Demographics | Rating | Rank | Female Poverty |
| Celtics | 49.9 /100 | #175 | Average 13.4% |
| Immigrants | Spain | 49.9 /100 | #176 | Average 13.4% |
| Immigrants | Morocco | 49.4 /100 | #177 | Average 13.4% |
| Israelis | 49.1 /100 | #178 | Average 13.5% |
| Immigrants | Syria | 48.8 /100 | #179 | Average 13.5% |
| South Americans | 44.8 /100 | #180 | Average 13.5% |
| Venezuelans | 44.5 /100 | #181 | Average 13.5% |
| Immigrants | Colombia | 44.5 /100 | #182 | Average 13.5% |
| Kenyans | 43.8 /100 | #183 | Average 13.5% |
| Immigrants | Sierra Leone | 43.2 /100 | #184 | Average 13.5% |
| Immigrants | Cameroon | 42.0 /100 | #185 | Average 13.5% |
| Immigrants | Portugal | 41.5 /100 | #186 | Average 13.6% |
| Immigrants | Venezuela | 41.0 /100 | #187 | Average 13.6% |
| Hawaiians | 39.9 /100 | #188 | Fair 13.6% |
| Uruguayans | 39.8 /100 | #189 | Fair 13.6% |