French Canadian vs Immigrants from Honduras Female Poverty
COMPARE
French Canadian
Immigrants from Honduras
Female Poverty
Female Poverty Comparison
French Canadians
Immigrants from Honduras
12.7%
FEMALE POVERTY
90.2/ 100
METRIC RATING
122nd/ 347
METRIC RANK
17.7%
FEMALE POVERTY
0.0/ 100
METRIC RATING
324th/ 347
METRIC RANK
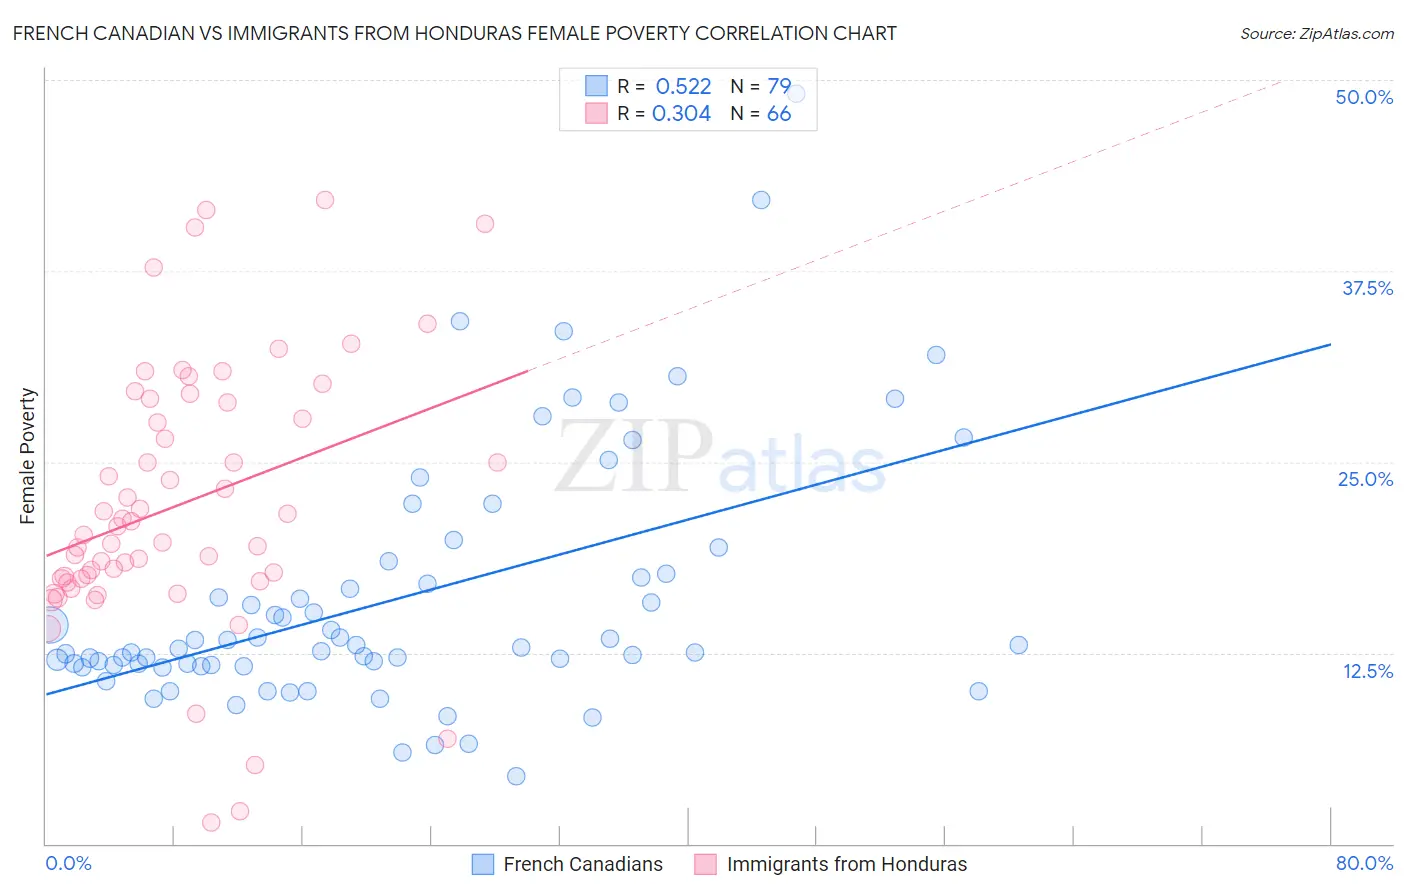
French Canadian vs Immigrants from Honduras Female Poverty Correlation Chart
The statistical analysis conducted on geographies consisting of 502,012,927 people shows a substantial positive correlation between the proportion of French Canadians and poverty level among females in the United States with a correlation coefficient (R) of 0.522 and weighted average of 12.7%. Similarly, the statistical analysis conducted on geographies consisting of 322,443,203 people shows a mild positive correlation between the proportion of Immigrants from Honduras and poverty level among females in the United States with a correlation coefficient (R) of 0.304 and weighted average of 17.7%, a difference of 39.3%.
Female Poverty Correlation Summary
| Measurement | French Canadian | Immigrants from Honduras |
| Minimum | 4.4% | 1.4% |
| Maximum | 49.1% | 42.1% |
| Range | 44.7% | 40.7% |
| Mean | 16.1% | 22.2% |
| Median | 12.8% | 20.5% |
| Interquartile 25% (IQ1) | 11.7% | 17.4% |
| Interquartile 75% (IQ3) | 17.6% | 28.9% |
| Interquartile Range (IQR) | 6.0% | 11.5% |
| Standard Deviation (Sample) | 8.3% | 8.7% |
| Standard Deviation (Population) | 8.2% | 8.6% |
Similar Demographics by Female Poverty
Demographics Similar to French Canadians by Female Poverty
In terms of female poverty, the demographic groups most similar to French Canadians are Immigrants from Hungary (12.7%, a difference of 0.040%), Immigrants from South Eastern Asia (12.7%, a difference of 0.070%), New Zealander (12.7%, a difference of 0.14%), Albanian (12.7%, a difference of 0.20%), and Sri Lankan (12.7%, a difference of 0.21%).
| Demographics | Rating | Rank | Female Poverty |
| Puget Sound Salish | 91.5 /100 | #115 | Exceptional 12.7% |
| Immigrants | Russia | 91.2 /100 | #116 | Exceptional 12.7% |
| Immigrants | Southern Europe | 90.9 /100 | #117 | Exceptional 12.7% |
| Sri Lankans | 90.9 /100 | #118 | Exceptional 12.7% |
| Albanians | 90.8 /100 | #119 | Exceptional 12.7% |
| New Zealanders | 90.6 /100 | #120 | Exceptional 12.7% |
| Immigrants | Hungary | 90.3 /100 | #121 | Exceptional 12.7% |
| French Canadians | 90.2 /100 | #122 | Exceptional 12.7% |
| Immigrants | South Eastern Asia | 89.9 /100 | #123 | Excellent 12.7% |
| Immigrants | Norway | 89.3 /100 | #124 | Excellent 12.8% |
| Argentineans | 89.1 /100 | #125 | Excellent 12.8% |
| Immigrants | Ukraine | 88.8 /100 | #126 | Excellent 12.8% |
| South Africans | 88.4 /100 | #127 | Excellent 12.8% |
| Immigrants | Belarus | 88.2 /100 | #128 | Excellent 12.8% |
| Immigrants | Brazil | 87.9 /100 | #129 | Excellent 12.8% |
Demographics Similar to Immigrants from Honduras by Female Poverty
In terms of female poverty, the demographic groups most similar to Immigrants from Honduras are Colville (17.8%, a difference of 0.15%), Paiute (17.7%, a difference of 0.18%), Menominee (17.6%, a difference of 0.77%), Arapaho (17.5%, a difference of 1.4%), and Immigrants from Dominica (17.5%, a difference of 1.5%).
| Demographics | Rating | Rank | Female Poverty |
| Immigrants | Congo | 0.0 /100 | #317 | Tragic 17.4% |
| Ute | 0.0 /100 | #318 | Tragic 17.5% |
| Cajuns | 0.0 /100 | #319 | Tragic 17.5% |
| Immigrants | Dominica | 0.0 /100 | #320 | Tragic 17.5% |
| Arapaho | 0.0 /100 | #321 | Tragic 17.5% |
| Menominee | 0.0 /100 | #322 | Tragic 17.6% |
| Paiute | 0.0 /100 | #323 | Tragic 17.7% |
| Immigrants | Honduras | 0.0 /100 | #324 | Tragic 17.7% |
| Colville | 0.0 /100 | #325 | Tragic 17.8% |
| Central American Indians | 0.0 /100 | #326 | Tragic 18.0% |
| Yakama | 0.0 /100 | #327 | Tragic 18.0% |
| Blacks/African Americans | 0.0 /100 | #328 | Tragic 18.6% |
| Kiowa | 0.0 /100 | #329 | Tragic 18.6% |
| Dominicans | 0.0 /100 | #330 | Tragic 19.1% |
| Natives/Alaskans | 0.0 /100 | #331 | Tragic 19.2% |