Liberian vs Puget Sound Salish Receiving Food Stamps
COMPARE
Liberian
Puget Sound Salish
Receiving Food Stamps
Receiving Food Stamps Comparison
Liberians
Puget Sound Salish
14.8%
RECEIVING FOOD STAMPS
0.1/ 100
METRIC RATING
276th/ 347
METRIC RANK
13.1%
RECEIVING FOOD STAMPS
3.4/ 100
METRIC RATING
230th/ 347
METRIC RANK
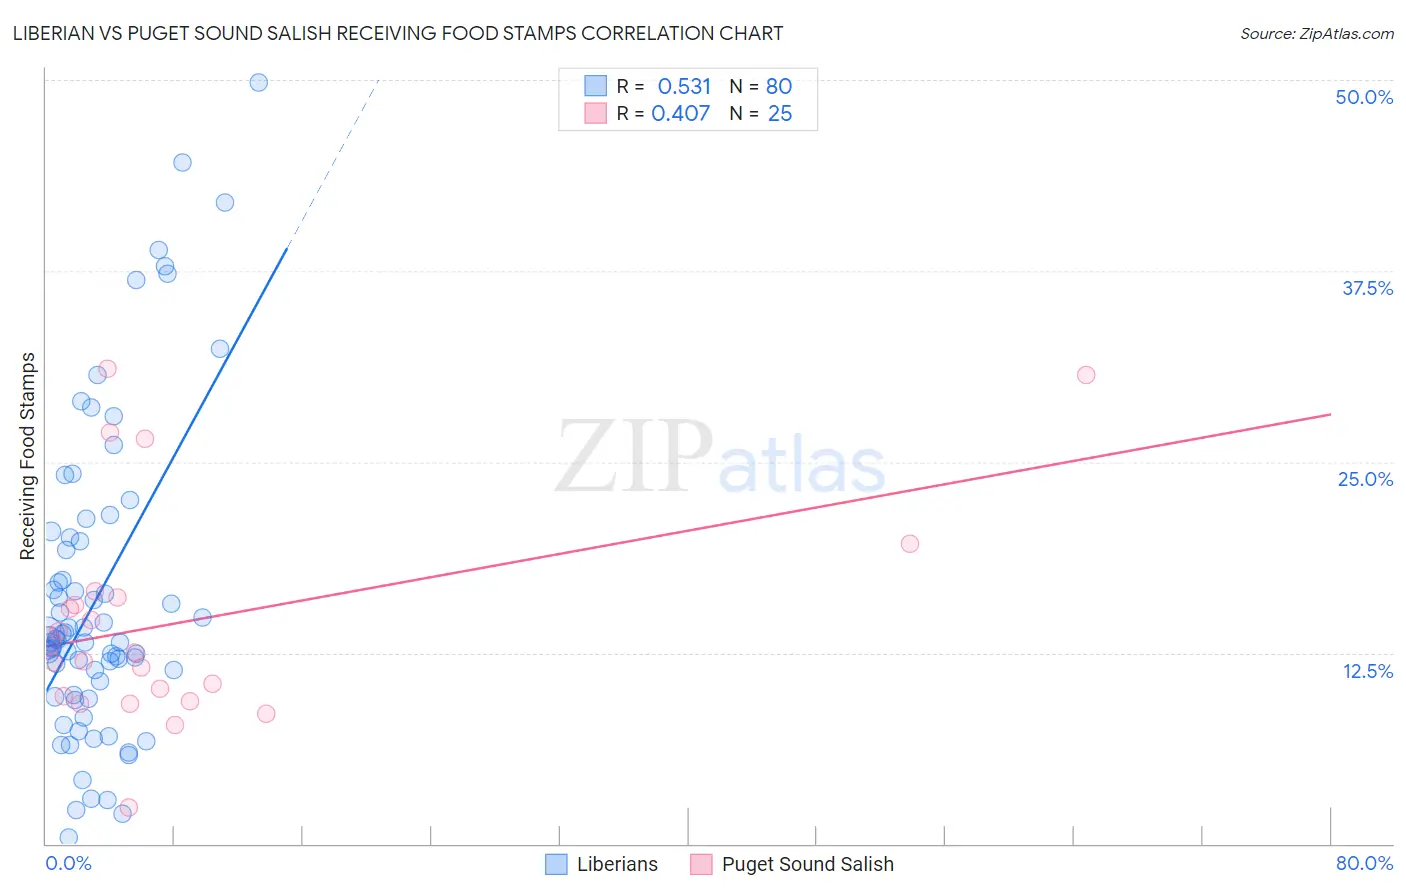
Liberian vs Puget Sound Salish Receiving Food Stamps Correlation Chart
The statistical analysis conducted on geographies consisting of 118,008,708 people shows a substantial positive correlation between the proportion of Liberians and percentage of population receiving government assistance and/or food stamps in the United States with a correlation coefficient (R) of 0.531 and weighted average of 14.8%. Similarly, the statistical analysis conducted on geographies consisting of 46,113,592 people shows a moderate positive correlation between the proportion of Puget Sound Salish and percentage of population receiving government assistance and/or food stamps in the United States with a correlation coefficient (R) of 0.407 and weighted average of 13.1%, a difference of 12.9%.
Receiving Food Stamps Correlation Summary
| Measurement | Liberian | Puget Sound Salish |
| Minimum | 0.40% | 2.4% |
| Maximum | 49.8% | 31.1% |
| Range | 49.4% | 28.7% |
| Mean | 16.2% | 14.6% |
| Median | 13.4% | 12.5% |
| Interquartile 25% (IQ1) | 10.2% | 9.5% |
| Interquartile 75% (IQ3) | 19.9% | 16.3% |
| Interquartile Range (IQR) | 9.7% | 6.9% |
| Standard Deviation (Sample) | 10.3% | 7.3% |
| Standard Deviation (Population) | 10.2% | 7.1% |
Similar Demographics by Receiving Food Stamps
Demographics Similar to Liberians by Receiving Food Stamps
In terms of receiving food stamps, the demographic groups most similar to Liberians are Seminole (14.8%, a difference of 0.050%), Belizean (14.8%, a difference of 0.18%), Kiowa (14.9%, a difference of 0.45%), Ecuadorian (14.9%, a difference of 0.50%), and Ute (14.7%, a difference of 0.71%).
| Demographics | Rating | Rank | Receiving Food Stamps |
| Nepalese | 0.1 /100 | #269 | Tragic 14.6% |
| Mexicans | 0.1 /100 | #270 | Tragic 14.6% |
| Immigrants | Guatemala | 0.1 /100 | #271 | Tragic 14.6% |
| Chippewa | 0.1 /100 | #272 | Tragic 14.7% |
| Alaskan Athabascans | 0.1 /100 | #273 | Tragic 14.7% |
| Immigrants | Western Africa | 0.1 /100 | #274 | Tragic 14.7% |
| Ute | 0.1 /100 | #275 | Tragic 14.7% |
| Liberians | 0.1 /100 | #276 | Tragic 14.8% |
| Seminole | 0.1 /100 | #277 | Tragic 14.8% |
| Belizeans | 0.1 /100 | #278 | Tragic 14.8% |
| Kiowa | 0.0 /100 | #279 | Tragic 14.9% |
| Ecuadorians | 0.0 /100 | #280 | Tragic 14.9% |
| Spanish American Indians | 0.0 /100 | #281 | Tragic 14.9% |
| Immigrants | Central America | 0.0 /100 | #282 | Tragic 15.0% |
| Bangladeshis | 0.0 /100 | #283 | Tragic 15.0% |
Demographics Similar to Puget Sound Salish by Receiving Food Stamps
In terms of receiving food stamps, the demographic groups most similar to Puget Sound Salish are Immigrants from Nigeria (13.1%, a difference of 0.040%), Ottawa (13.1%, a difference of 0.050%), Panamanian (13.1%, a difference of 0.060%), Nigerian (13.1%, a difference of 0.070%), and Chickasaw (13.1%, a difference of 0.12%).
| Demographics | Rating | Rank | Receiving Food Stamps |
| Immigrants | Albania | 4.4 /100 | #223 | Tragic 13.0% |
| Immigrants | Armenia | 4.3 /100 | #224 | Tragic 13.0% |
| Fijians | 4.3 /100 | #225 | Tragic 13.0% |
| Chickasaw | 3.6 /100 | #226 | Tragic 13.1% |
| Nigerians | 3.5 /100 | #227 | Tragic 13.1% |
| Panamanians | 3.5 /100 | #228 | Tragic 13.1% |
| Ottawa | 3.5 /100 | #229 | Tragic 13.1% |
| Puget Sound Salish | 3.4 /100 | #230 | Tragic 13.1% |
| Immigrants | Nigeria | 3.4 /100 | #231 | Tragic 13.1% |
| Salvadorans | 2.7 /100 | #232 | Tragic 13.2% |
| Cherokee | 2.5 /100 | #233 | Tragic 13.2% |
| Comanche | 2.4 /100 | #234 | Tragic 13.3% |
| Immigrants | Zaire | 1.9 /100 | #235 | Tragic 13.4% |
| Crow | 1.6 /100 | #236 | Tragic 13.4% |
| Immigrants | El Salvador | 1.5 /100 | #237 | Tragic 13.5% |