Native Hawaiian vs Puerto Rican Receiving Food Stamps
COMPARE
Native Hawaiian
Puerto Rican
Receiving Food Stamps
Receiving Food Stamps Comparison
Native Hawaiians
Puerto Ricans
12.8%
RECEIVING FOOD STAMPS
6.7/ 100
METRIC RATING
215th/ 347
METRIC RANK
26.0%
RECEIVING FOOD STAMPS
0.0/ 100
METRIC RATING
346th/ 347
METRIC RANK
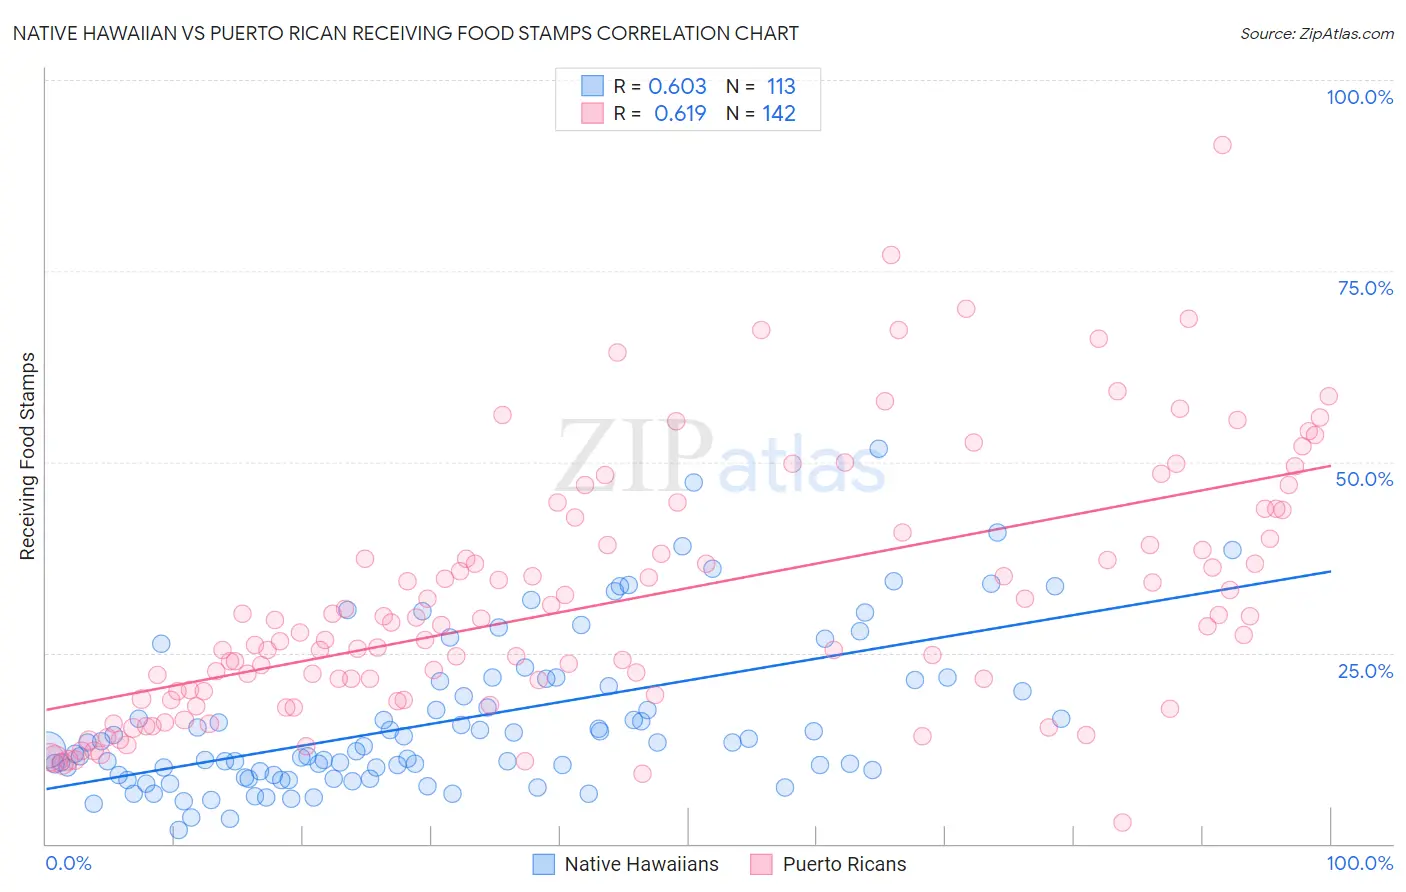
Native Hawaiian vs Puerto Rican Receiving Food Stamps Correlation Chart
The statistical analysis conducted on geographies consisting of 331,508,254 people shows a significant positive correlation between the proportion of Native Hawaiians and percentage of population receiving government assistance and/or food stamps in the United States with a correlation coefficient (R) of 0.603 and weighted average of 12.8%. Similarly, the statistical analysis conducted on geographies consisting of 525,950,641 people shows a significant positive correlation between the proportion of Puerto Ricans and percentage of population receiving government assistance and/or food stamps in the United States with a correlation coefficient (R) of 0.619 and weighted average of 26.0%, a difference of 102.5%.
Receiving Food Stamps Correlation Summary
| Measurement | Native Hawaiian | Puerto Rican |
| Minimum | 1.9% | 2.8% |
| Maximum | 51.7% | 91.5% |
| Range | 49.8% | 88.7% |
| Mean | 16.1% | 31.7% |
| Median | 12.8% | 28.6% |
| Interquartile 25% (IQ1) | 9.0% | 19.5% |
| Interquartile 75% (IQ3) | 21.4% | 40.0% |
| Interquartile Range (IQR) | 12.4% | 20.5% |
| Standard Deviation (Sample) | 10.1% | 16.3% |
| Standard Deviation (Population) | 10.1% | 16.3% |
Similar Demographics by Receiving Food Stamps
Demographics Similar to Native Hawaiians by Receiving Food Stamps
In terms of receiving food stamps, the demographic groups most similar to Native Hawaiians are Immigrants from South America (12.8%, a difference of 0.11%), Immigrants from Burma/Myanmar (12.9%, a difference of 0.36%), Immigrants from Africa (12.8%, a difference of 0.44%), Moroccan (12.8%, a difference of 0.47%), and Hawaiian (12.9%, a difference of 0.73%).
| Demographics | Rating | Rank | Receiving Food Stamps |
| Potawatomi | 14.6 /100 | #208 | Poor 12.5% |
| Immigrants | Sierra Leone | 12.9 /100 | #209 | Poor 12.5% |
| Immigrants | Uruguay | 12.8 /100 | #210 | Poor 12.5% |
| Colombians | 10.2 /100 | #211 | Poor 12.6% |
| Malaysians | 8.5 /100 | #212 | Tragic 12.7% |
| Moroccans | 7.6 /100 | #213 | Tragic 12.8% |
| Immigrants | Africa | 7.6 /100 | #214 | Tragic 12.8% |
| Native Hawaiians | 6.7 /100 | #215 | Tragic 12.8% |
| Immigrants | South America | 6.5 /100 | #216 | Tragic 12.8% |
| Immigrants | Burma/Myanmar | 6.0 /100 | #217 | Tragic 12.9% |
| Hawaiians | 5.4 /100 | #218 | Tragic 12.9% |
| Immigrants | Middle Africa | 5.4 /100 | #219 | Tragic 12.9% |
| Immigrants | Colombia | 5.3 /100 | #220 | Tragic 12.9% |
| Bermudans | 4.8 /100 | #221 | Tragic 13.0% |
| Immigrants | Immigrants | 4.4 /100 | #222 | Tragic 13.0% |
Demographics Similar to Puerto Ricans by Receiving Food Stamps
In terms of receiving food stamps, the demographic groups most similar to Puerto Ricans are Immigrants from Cabo Verde (23.8%, a difference of 8.9%), Lumbee (22.9%, a difference of 13.3%), Immigrants from Dominican Republic (22.1%, a difference of 17.3%), Immigrants from Yemen (21.6%, a difference of 20.0%), and Hopi (21.6%, a difference of 20.5%).
| Demographics | Rating | Rank | Receiving Food Stamps |
| Inupiat | 0.0 /100 | #333 | Tragic 20.1% |
| Yuman | 0.0 /100 | #334 | Tragic 20.2% |
| Immigrants | Cuba | 0.0 /100 | #335 | Tragic 20.8% |
| Navajo | 0.0 /100 | #336 | Tragic 21.1% |
| Cape Verdeans | 0.0 /100 | #337 | Tragic 21.1% |
| Dominicans | 0.0 /100 | #338 | Tragic 21.4% |
| Yakama | 0.0 /100 | #339 | Tragic 21.4% |
| Tohono O'odham | 0.0 /100 | #340 | Tragic 21.5% |
| Hopi | 0.0 /100 | #341 | Tragic 21.6% |
| Immigrants | Yemen | 0.0 /100 | #342 | Tragic 21.6% |
| Immigrants | Dominican Republic | 0.0 /100 | #343 | Tragic 22.1% |
| Lumbee | 0.0 /100 | #344 | Tragic 22.9% |
| Immigrants | Cabo Verde | 0.0 /100 | #345 | Tragic 23.8% |
| Puerto Ricans | 0.0 /100 | #346 | Tragic 26.0% |
| Yup'ik | 0.0 /100 | #347 | Tragic 32.7% |