Spanish American Indian vs Nicaraguan Receiving Food Stamps
COMPARE
Spanish American Indian
Nicaraguan
Receiving Food Stamps
Receiving Food Stamps Comparison
Spanish American Indians
Nicaraguans
14.9%
RECEIVING FOOD STAMPS
0.0/ 100
METRIC RATING
281st/ 347
METRIC RANK
16.1%
RECEIVING FOOD STAMPS
0.0/ 100
METRIC RATING
303rd/ 347
METRIC RANK
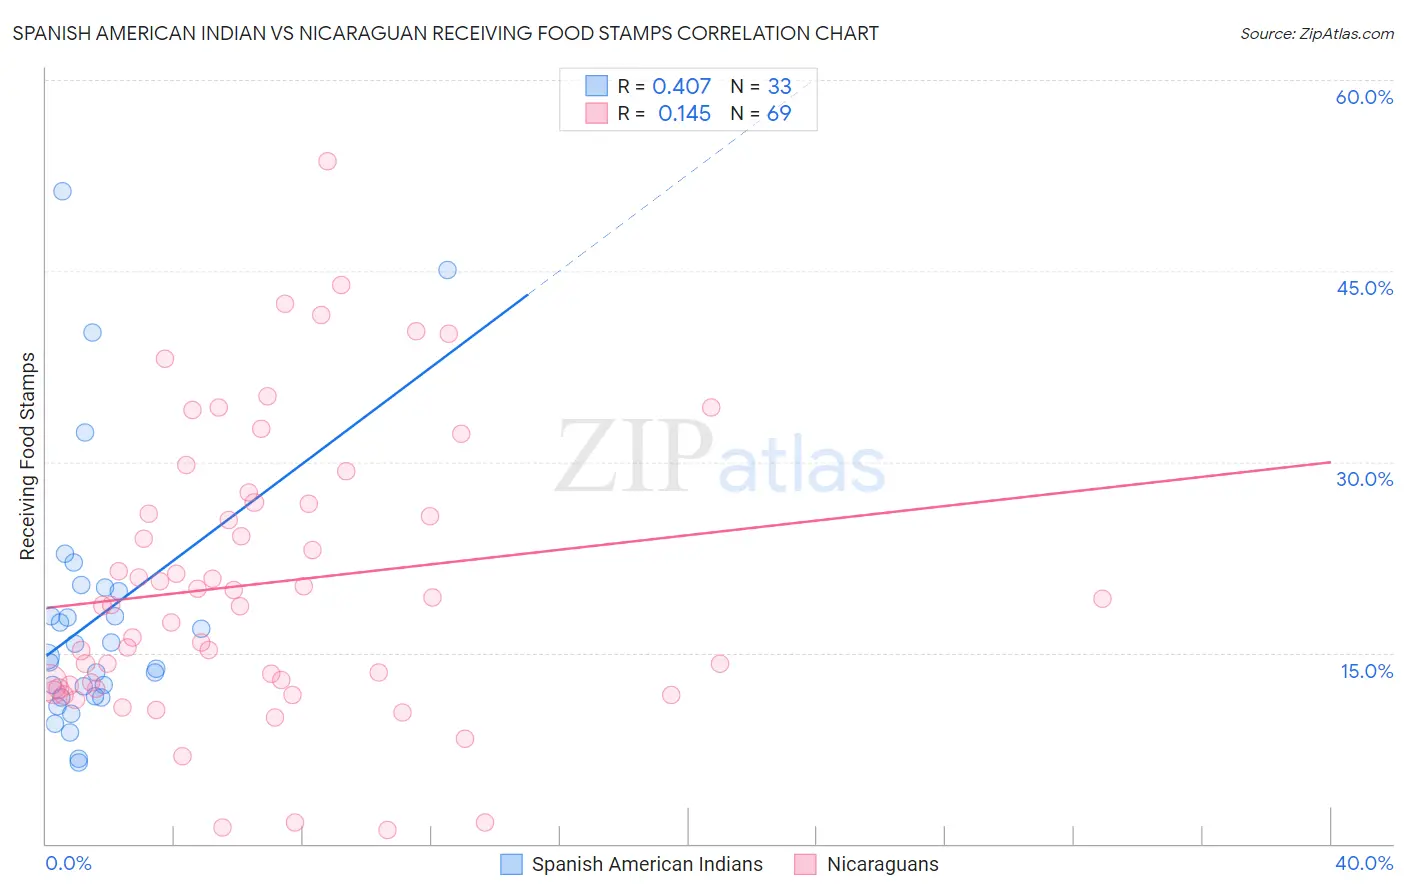
Spanish American Indian vs Nicaraguan Receiving Food Stamps Correlation Chart
The statistical analysis conducted on geographies consisting of 73,107,965 people shows a moderate positive correlation between the proportion of Spanish American Indians and percentage of population receiving government assistance and/or food stamps in the United States with a correlation coefficient (R) of 0.407 and weighted average of 14.9%. Similarly, the statistical analysis conducted on geographies consisting of 285,345,977 people shows a poor positive correlation between the proportion of Nicaraguans and percentage of population receiving government assistance and/or food stamps in the United States with a correlation coefficient (R) of 0.145 and weighted average of 16.1%, a difference of 8.2%.
Receiving Food Stamps Correlation Summary
| Measurement | Spanish American Indian | Nicaraguan |
| Minimum | 6.4% | 1.1% |
| Maximum | 51.3% | 53.6% |
| Range | 44.9% | 52.5% |
| Mean | 17.8% | 20.4% |
| Median | 14.7% | 18.7% |
| Interquartile 25% (IQ1) | 11.5% | 12.3% |
| Interquartile 75% (IQ3) | 20.0% | 26.7% |
| Interquartile Range (IQR) | 8.5% | 14.4% |
| Standard Deviation (Sample) | 10.4% | 11.2% |
| Standard Deviation (Population) | 10.2% | 11.1% |
Similar Demographics by Receiving Food Stamps
Demographics Similar to Spanish American Indians by Receiving Food Stamps
In terms of receiving food stamps, the demographic groups most similar to Spanish American Indians are Ecuadorian (14.9%, a difference of 0.32%), Kiowa (14.9%, a difference of 0.37%), Immigrants from Central America (15.0%, a difference of 0.52%), Belizean (14.8%, a difference of 0.64%), and Seminole (14.8%, a difference of 0.77%).
| Demographics | Rating | Rank | Receiving Food Stamps |
| Immigrants | Western Africa | 0.1 /100 | #274 | Tragic 14.7% |
| Ute | 0.1 /100 | #275 | Tragic 14.7% |
| Liberians | 0.1 /100 | #276 | Tragic 14.8% |
| Seminole | 0.1 /100 | #277 | Tragic 14.8% |
| Belizeans | 0.1 /100 | #278 | Tragic 14.8% |
| Kiowa | 0.0 /100 | #279 | Tragic 14.9% |
| Ecuadorians | 0.0 /100 | #280 | Tragic 14.9% |
| Spanish American Indians | 0.0 /100 | #281 | Tragic 14.9% |
| Immigrants | Central America | 0.0 /100 | #282 | Tragic 15.0% |
| Bangladeshis | 0.0 /100 | #283 | Tragic 15.0% |
| Immigrants | Ecuador | 0.0 /100 | #284 | Tragic 15.0% |
| Immigrants | Liberia | 0.0 /100 | #285 | Tragic 15.1% |
| Africans | 0.0 /100 | #286 | Tragic 15.1% |
| Immigrants | Mexico | 0.0 /100 | #287 | Tragic 15.2% |
| Immigrants | Belize | 0.0 /100 | #288 | Tragic 15.2% |
Demographics Similar to Nicaraguans by Receiving Food Stamps
In terms of receiving food stamps, the demographic groups most similar to Nicaraguans are Immigrants from West Indies (16.1%, a difference of 0.090%), West Indian (16.3%, a difference of 0.68%), Trinidadian and Tobagonian (16.0%, a difference of 1.0%), Immigrants from Bangladesh (15.9%, a difference of 1.5%), and Immigrants from the Azores (16.4%, a difference of 1.6%).
| Demographics | Rating | Rank | Receiving Food Stamps |
| Tsimshian | 0.0 /100 | #296 | Tragic 15.7% |
| Immigrants | Bahamas | 0.0 /100 | #297 | Tragic 15.8% |
| Immigrants | Trinidad and Tobago | 0.0 /100 | #298 | Tragic 15.8% |
| Hispanics or Latinos | 0.0 /100 | #299 | Tragic 15.8% |
| Immigrants | Bangladesh | 0.0 /100 | #300 | Tragic 15.9% |
| Trinidadians and Tobagonians | 0.0 /100 | #301 | Tragic 16.0% |
| Immigrants | West Indies | 0.0 /100 | #302 | Tragic 16.1% |
| Nicaraguans | 0.0 /100 | #303 | Tragic 16.1% |
| West Indians | 0.0 /100 | #304 | Tragic 16.3% |
| Immigrants | Azores | 0.0 /100 | #305 | Tragic 16.4% |
| Jamaicans | 0.0 /100 | #306 | Tragic 16.4% |
| Houma | 0.0 /100 | #307 | Tragic 16.5% |
| Barbadians | 0.0 /100 | #308 | Tragic 16.5% |
| U.S. Virgin Islanders | 0.0 /100 | #309 | Tragic 16.5% |
| Immigrants | Barbados | 0.0 /100 | #310 | Tragic 16.6% |