Romanian vs Sri Lankan Poverty

COMPARE

Romanian
Race
Ancestry
AfghanAfricanAlaska NativeAlaskan AthabascanAlbanianAleutAlsatianAmericanApacheArabArapahoArgentineanArmenianAssyrian/Chaldean/SyriacAustralianAustrianBahamianBangladeshiBarbadianBasqueBelgianBelizeanBermudanBhutaneseBlackfeetBolivianBrazilianBritishBritish West IndianBulgarianBurmeseCajunCambodianCanadianCape VerdeanCarpatho RusynCelticCentral AmericanCentral American IndianCherokeeCheyenneChickasawChileanChineseChippewaChoctawColombianColvilleComancheCosta RicanCreeCreekCroatianCrowCubanCypriotCzechCzechoslovakianDanishDelawareDominicanDutchDutch West IndianEastern EuropeanEcuadorianEgyptianEnglishEstonianEthiopianEuropeanFijianFilipinoFinnishFrenchFrench American IndianFrench CanadianGermanGerman RussianGhanaianGreekGuamanian/ChamorroGuatemalanGuyaneseHaitianHmongHonduranHopiHoumaHungarianIcelanderIndian (Asian)IndonesianInupiatIranianIraqiIrishIroquoisIsraeliItalianJamaicanJapaneseJordanianKenyanKiowaKoreanLaotianLatvianLebaneseLiberianLithuanianLumbeeLuxembourgerMacedonianMalaysianMalteseMarshalleseMenomineeMexicanMexican American IndianMongolianMoroccanNative HawaiianNavajoNepaleseNew ZealanderNicaraguanNigerianNorthern EuropeanNorwegianOkinawanOsageOttawaPaiutePakistaniPalestinianPanamanianParaguayanPennsylvania GermanPeruvianPimaPolishPortuguesePotawatomiPuebloPuerto RicanPuget Sound SalishRomanianRussianSalvadoranSamoanScandinavianScotch-IrishScottishSeminoleSenegaleseSerbianShoshoneSierra LeoneanSiouxSlavicSlovakSloveneSomaliSouth AfricanSouth AmericanSouth American IndianSoviet UnionSpaniardSpanishSpanish AmericanSpanish American IndianSubsaharan AfricanSudaneseSwedishSwissSyrianTaiwaneseThaiTlingit-HaidaTohono O'OdhamTonganTrinidadian and TobagonianTsimshianTurkishU.S. Virgin IslanderUgandanUkrainianUruguayanUteVenezuelanVietnameseWelshWest IndianYakamaYaquiYugoslavianYumanYup'ikZimbabwean
Immigration
NonimmigrantsImmigrantsAfghanistanAfricaAlbaniaArgentinaArmeniaAsiaAustraliaAustriaBahamasBangladeshBarbadosBelarusBelgiumBelizeBoliviaBosnia and HerzegovinaBrazilBulgariaBurma/MyanmarCabo VerdeCambodiaCameroonCanadaCaribbeanCentral AmericaChileChinaColombiaCongoCosta RicaCroatiaCubaCzechoslovakiaDenmarkDominicaDominican RepublicEastern AfricaEastern AsiaEastern EuropeEcuadorEgyptEl SalvadorEnglandEritreaEthiopiaEuropeFijiFranceGermanyGhanaGreeceGrenadaGuatemalaGuyanaHaitiHondurasHong KongHungaryIndiaIndonesiaIranIraqIrelandIsraelItalyJamaicaJapanJordanKazakhstanKenyaKoreaKuwaitLaosLatin AmericaLatviaLebanonLiberiaLithuaniaMalaysiaMexicoMicronesiaMiddle AfricaMoldovaMoroccoNepalNetherlandsNicaraguaNigeriaNorth AmericaNorth MacedoniaNorthern AfricaNorthern EuropeNorwayOceaniaPakistanPanamaPeruPhilippinesPolandPortugalRomaniaRussiaSaudi ArabiaScotlandSenegalSerbiaSierra LeoneSingaporeSomaliaSouth AfricaSouth AmericaSouth Central AsiaSouth Eastern AsiaSouthern EuropeSpainSri LankaSt. Vincent and the GrenadinesSudanSwedenSwitzerlandSyriaTaiwanThailandTrinidad and TobagoTurkeyUgandaUkraineUruguayUzbekistanVenezuelaVietnamWest IndiesWestern AfricaWestern AsiaWestern EuropeYemenZaireZimbabweAzores
Sri Lankan
Race
Ancestry
AfghanAfricanAlaska NativeAlaskan AthabascanAlbanianAleutAlsatianAmericanApacheArabArapahoArgentineanArmenianAssyrian/Chaldean/SyriacAustralianAustrianBahamianBangladeshiBarbadianBasqueBelgianBelizeanBermudanBhutaneseBlackfeetBolivianBrazilianBritishBritish West IndianBulgarianBurmeseCajunCambodianCanadianCape VerdeanCarpatho RusynCelticCentral AmericanCentral American IndianCherokeeCheyenneChickasawChileanChineseChippewaChoctawColombianColvilleComancheCosta RicanCreeCreekCroatianCrowCubanCypriotCzechCzechoslovakianDanishDelawareDominicanDutchDutch West IndianEastern EuropeanEcuadorianEgyptianEnglishEstonianEthiopianEuropeanFijianFilipinoFinnishFrenchFrench American IndianFrench CanadianGermanGerman RussianGhanaianGreekGuamanian/ChamorroGuatemalanGuyaneseHaitianHmongHonduranHopiHoumaHungarianIcelanderIndian (Asian)IndonesianInupiatIranianIraqiIrishIroquoisIsraeliItalianJamaicanJapaneseJordanianKenyanKiowaKoreanLaotianLatvianLebaneseLiberianLithuanianLumbeeLuxembourgerMacedonianMalaysianMalteseMarshalleseMenomineeMexicanMexican American IndianMongolianMoroccanNative HawaiianNavajoNepaleseNew ZealanderNicaraguanNigerianNorthern EuropeanNorwegianOkinawanOsageOttawaPaiutePakistaniPalestinianPanamanianParaguayanPennsylvania GermanPeruvianPimaPolishPortuguesePotawatomiPuebloPuerto RicanPuget Sound SalishRussianSalvadoranSamoanScandinavianScotch-IrishScottishSeminoleSenegaleseSerbianShoshoneSierra LeoneanSiouxSlavicSlovakSloveneSomaliSouth AfricanSouth AmericanSouth American IndianSoviet UnionSpaniardSpanishSpanish AmericanSpanish American IndianSri LankanSubsaharan AfricanSudaneseSwedishSwissSyrianTaiwaneseThaiTlingit-HaidaTohono O'OdhamTonganTrinidadian and TobagonianTsimshianTurkishU.S. Virgin IslanderUgandanUkrainianUruguayanUteVenezuelanVietnameseWelshWest IndianYakamaYaquiYugoslavianYumanYup'ikZimbabwean
Immigration
NonimmigrantsImmigrantsAfghanistanAfricaAlbaniaArgentinaArmeniaAsiaAustraliaAustriaBahamasBangladeshBarbadosBelarusBelgiumBelizeBoliviaBosnia and HerzegovinaBrazilBulgariaBurma/MyanmarCabo VerdeCambodiaCameroonCanadaCaribbeanCentral AmericaChileChinaColombiaCongoCosta RicaCroatiaCubaCzechoslovakiaDenmarkDominicaDominican RepublicEastern AfricaEastern AsiaEastern EuropeEcuadorEgyptEl SalvadorEnglandEritreaEthiopiaEuropeFijiFranceGermanyGhanaGreeceGrenadaGuatemalaGuyanaHaitiHondurasHong KongHungaryIndiaIndonesiaIranIraqIrelandIsraelItalyJamaicaJapanJordanKazakhstanKenyaKoreaKuwaitLaosLatin AmericaLatviaLebanonLiberiaLithuaniaMalaysiaMexicoMicronesiaMiddle AfricaMoldovaMoroccoNepalNetherlandsNicaraguaNigeriaNorth AmericaNorth MacedoniaNorthern AfricaNorthern EuropeNorwayOceaniaPakistanPanamaPeruPhilippinesPolandPortugalRomaniaRussiaSaudi ArabiaScotlandSenegalSerbiaSierra LeoneSingaporeSomaliaSouth AfricaSouth AmericaSouth Central AsiaSouth Eastern AsiaSouthern EuropeSpainSri LankaSt. Vincent and the GrenadinesSudanSwedenSwitzerlandSyriaTaiwanThailandTrinidad and TobagoTurkeyUgandaUkraineUruguayUzbekistanVenezuelaVietnamWest IndiesWestern AfricaWestern AsiaWestern EuropeYemenZaireZimbabweAzores
Poverty
Income
Poverty
Unemployment
Labor Participation
Family Structure
Vehicle Availability
Education Level
Disability

Poverty Comparison

Romanians

Sri Lankans

Exceptional
Excellent
11.4%
POVERTY
94.9/ 100
METRIC RATING
93rd/ 347
METRIC RANK
11.7%
POVERTY
89.4/ 100
METRIC RATING
117th/ 347
METRIC RANK

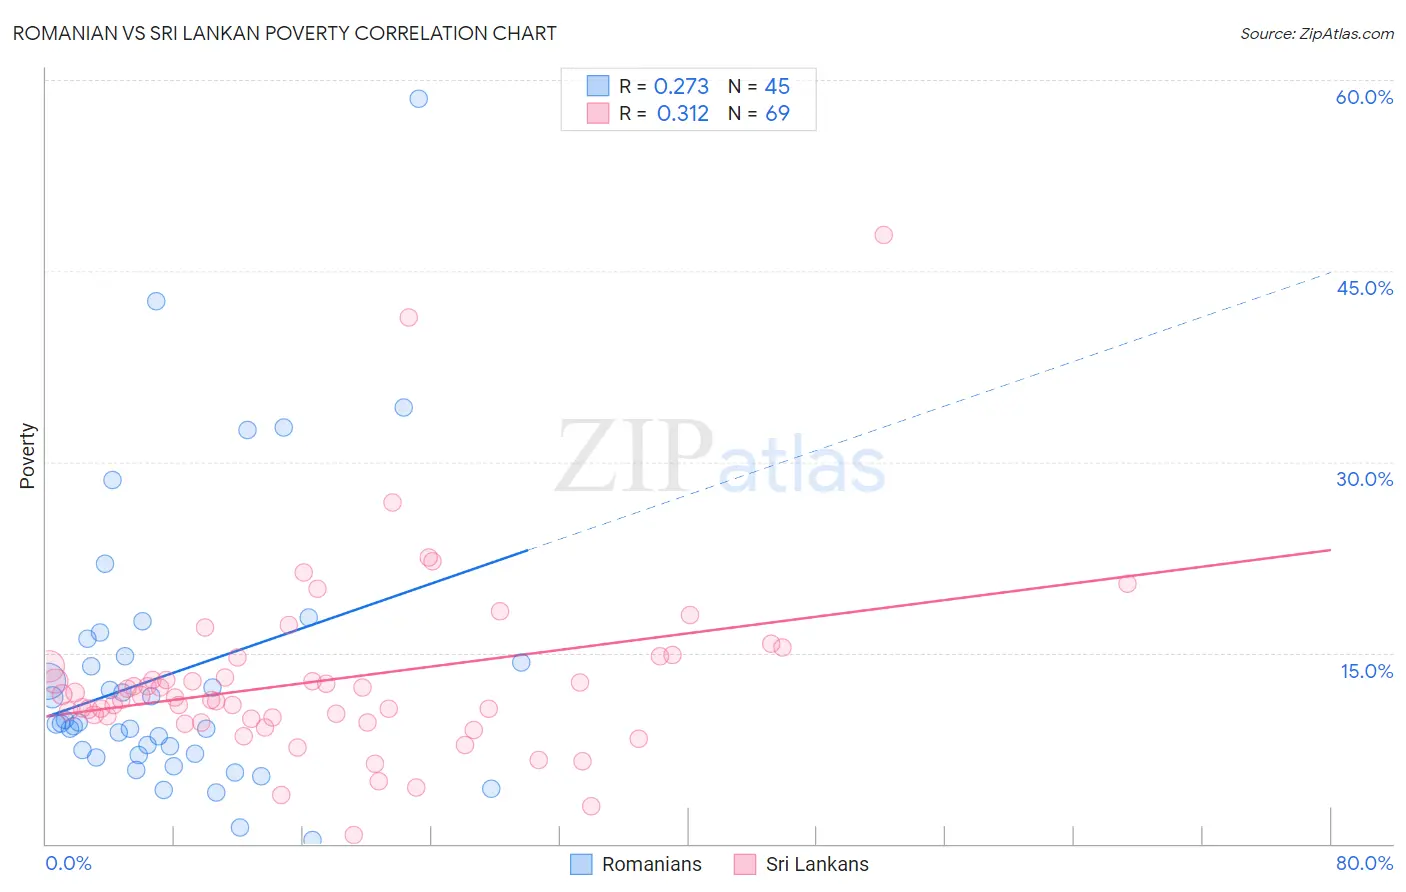
Romanian vs Sri Lankan Poverty Correlation Chart

The statistical analysis conducted on geographies consisting of 377,713,994 people shows a weak positive correlation between the proportion of Romanians and poverty level in the United States with a correlation coefficient (R) of 0.273 and weighted average of 11.4%. Similarly, the statistical analysis conducted on geographies consisting of 440,138,450 people shows a mild positive correlation between the proportion of Sri Lankans and poverty level in the United States with a correlation coefficient (R) of 0.312 and weighted average of 11.7%, a difference of 2.1%.
Romanian vs Sri Lankan Poverty

Poverty Correlation Summary

MeasurementRomanianSri Lankan
Minimum0.31%0.64%
Maximum58.5%47.9%
Range58.2%47.2%
Mean13.5%12.9%
Median9.4%11.5%
Interquartile 25% (IQ1)7.0%9.7%
Interquartile 75% (IQ3)15.4%14.3%
Interquartile Range (IQR)8.4%4.6%
Standard Deviation (Sample)11.3%7.2%
Standard Deviation (Population)11.2%7.2%

Similar Demographics by Poverty

Demographics Similar to Romanians by Poverty

In terms of poverty, the demographic groups most similar to Romanians are Paraguayan (11.4%, a difference of 0.020%), Australian (11.4%, a difference of 0.020%), British (11.4%, a difference of 0.030%), Immigrants from South Africa (11.5%, a difference of 0.14%), and Finnish (11.4%, a difference of 0.17%).
DemographicsRating | RankPoverty
Jordanians
96.0
/100
|
#86
Exceptional
11.4%
Northern Europeans
96.0
/100
|
#87
Exceptional
11.4%
Belgians
95.8
/100
|
#88
Exceptional
11.4%
Czechoslovakians
95.7
/100
|
#89
Exceptional
11.4%
Immigrants | Denmark
95.5
/100
|
#90
Exceptional
11.4%
Finns
95.2
/100
|
#91
Exceptional
11.4%
British
95.0
/100
|
#92
Exceptional
11.4%
Romanians
94.9
/100
|
#93
Exceptional
11.4%
Paraguayans
94.9
/100
|
#94
Exceptional
11.4%
Australians
94.9
/100
|
#95
Exceptional
11.4%
Immigrants | South Africa
94.7
/100
|
#96
Exceptional
11.5%
Immigrants | Egypt
94.6
/100
|
#97
Exceptional
11.5%
Immigrants | Latvia
94.5
/100
|
#98
Exceptional
11.5%
Immigrants | Indonesia
94.2
/100
|
#99
Exceptional
11.5%
Scottish
94.0
/100
|
#100
Exceptional
11.5%

Demographics Similar to Sri Lankans by Poverty

In terms of poverty, the demographic groups most similar to Sri Lankans are Immigrants from Russia (11.7%, a difference of 0.070%), Argentinean (11.7%, a difference of 0.080%), Tlingit-Haida (11.7%, a difference of 0.12%), Immigrants from South Eastern Asia (11.7%, a difference of 0.13%), and New Zealander (11.7%, a difference of 0.19%).
DemographicsRating | RankPoverty
Welsh
91.6
/100
|
#110
Exceptional
11.6%
French Canadians
91.0
/100
|
#111
Exceptional
11.6%
Immigrants | Southern Europe
90.8
/100
|
#112
Exceptional
11.6%
Immigrants | Belarus
90.8
/100
|
#113
Exceptional
11.6%
Immigrants | China
90.7
/100
|
#114
Exceptional
11.6%
Albanians
90.3
/100
|
#115
Exceptional
11.7%
Immigrants | Russia
89.7
/100
|
#116
Excellent
11.7%
Sri Lankans
89.4
/100
|
#117
Excellent
11.7%
Argentineans
89.1
/100
|
#118
Excellent
11.7%
Tlingit-Haida
89.0
/100
|
#119
Excellent
11.7%
Immigrants | South Eastern Asia
88.9
/100
|
#120
Excellent
11.7%
New Zealanders
88.7
/100
|
#121
Excellent
11.7%
Puget Sound Salish
88.7
/100
|
#122
Excellent
11.7%
Immigrants | Hungary
88.6
/100
|
#123
Excellent
11.7%
Soviet Union
88.4
/100
|
#124
Excellent
11.7%